Performance
Monitoring → Performance shows compute utilization, storage I/O and RDMA bandwidth for the selected node.
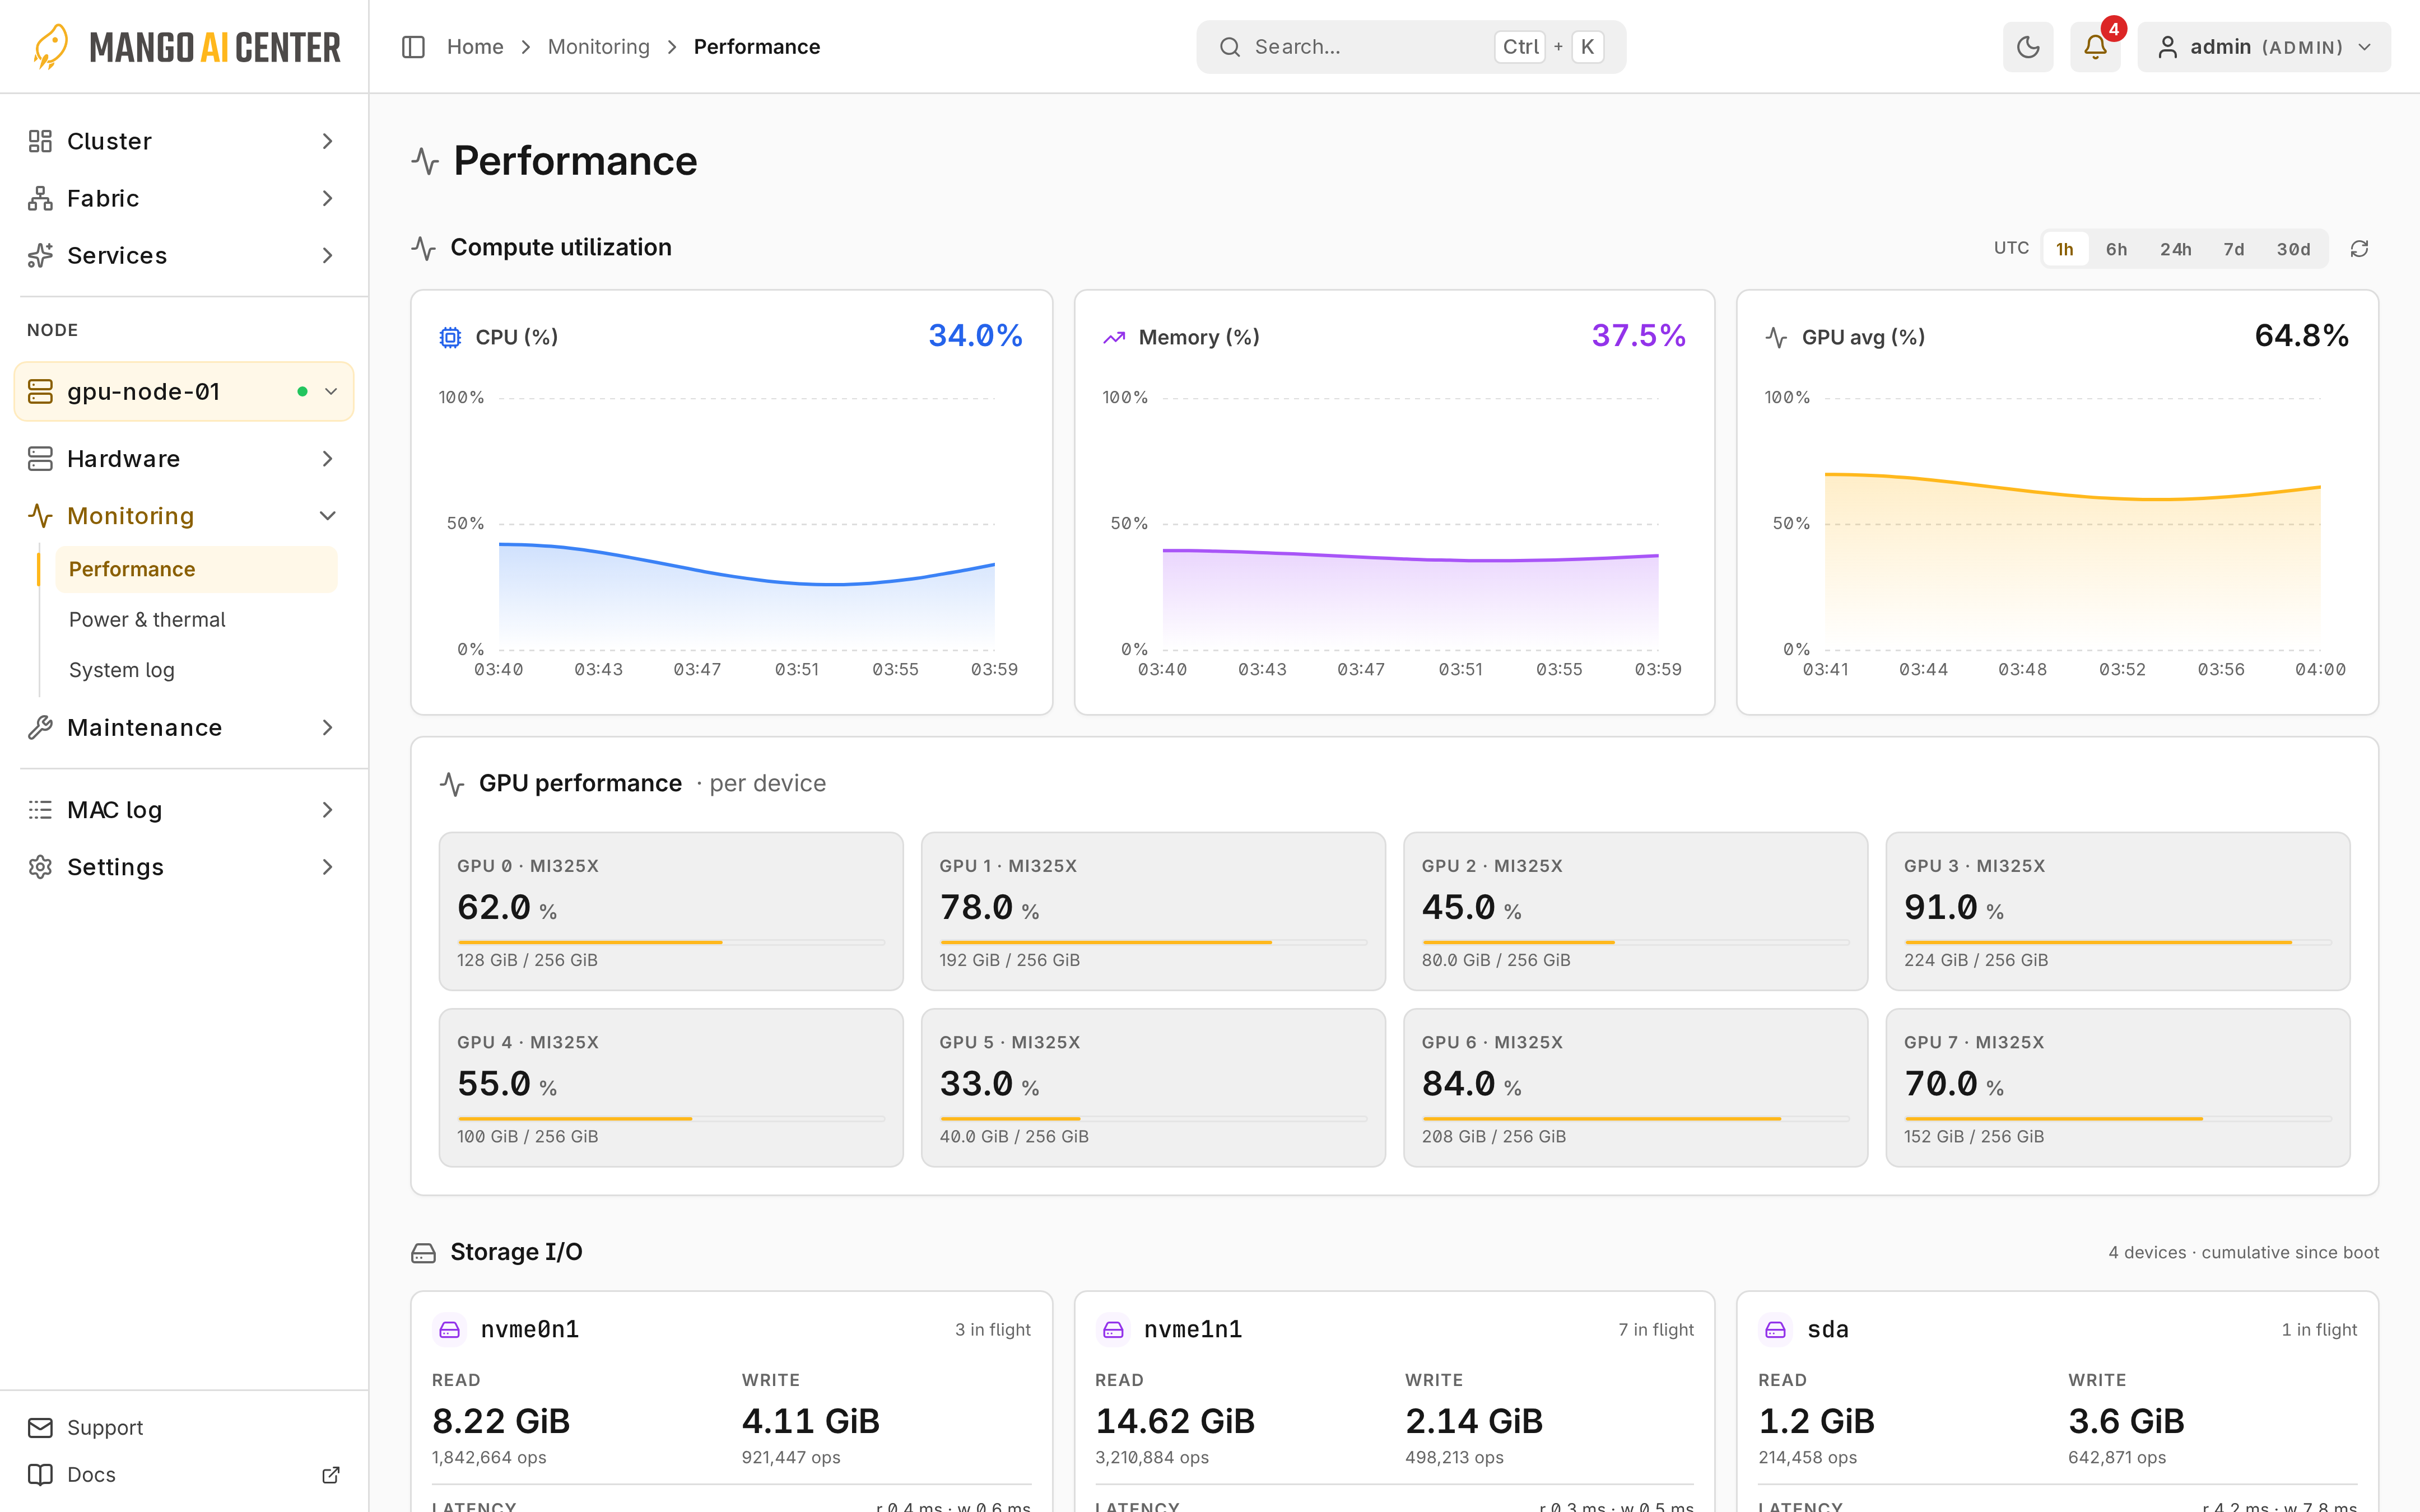
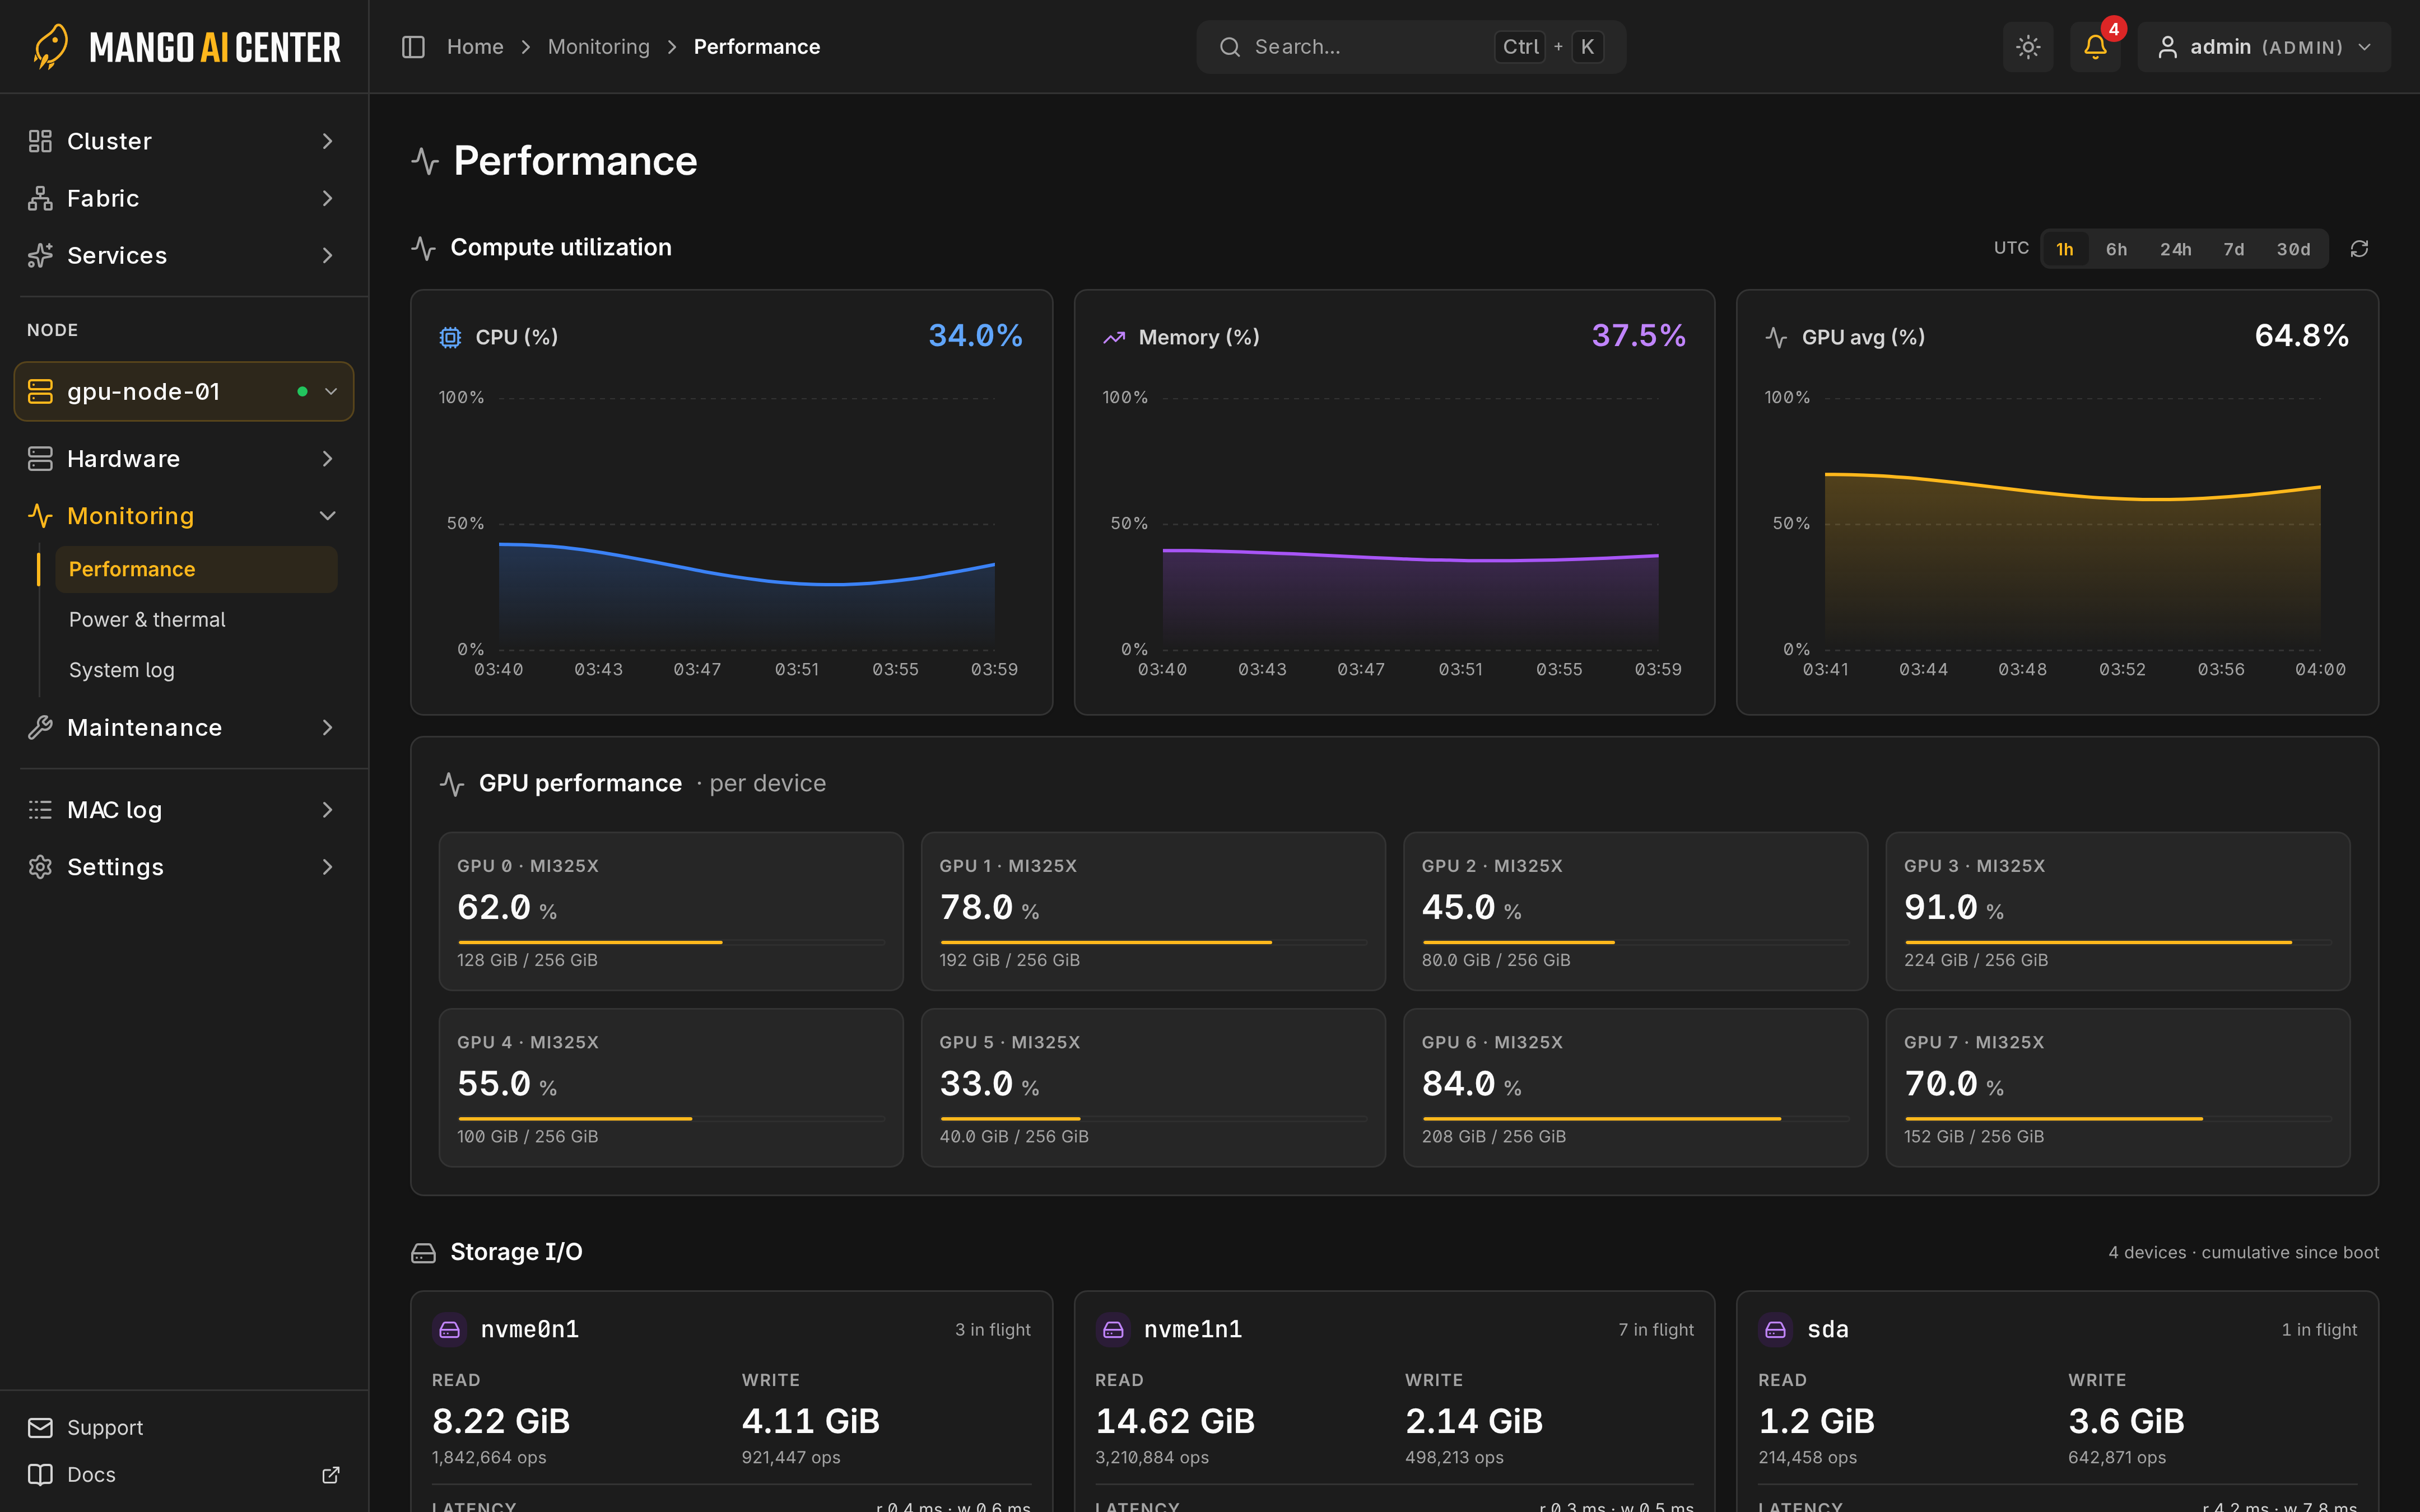
Compute utilization
CPU, memory and GPU utilization, with its own time range.
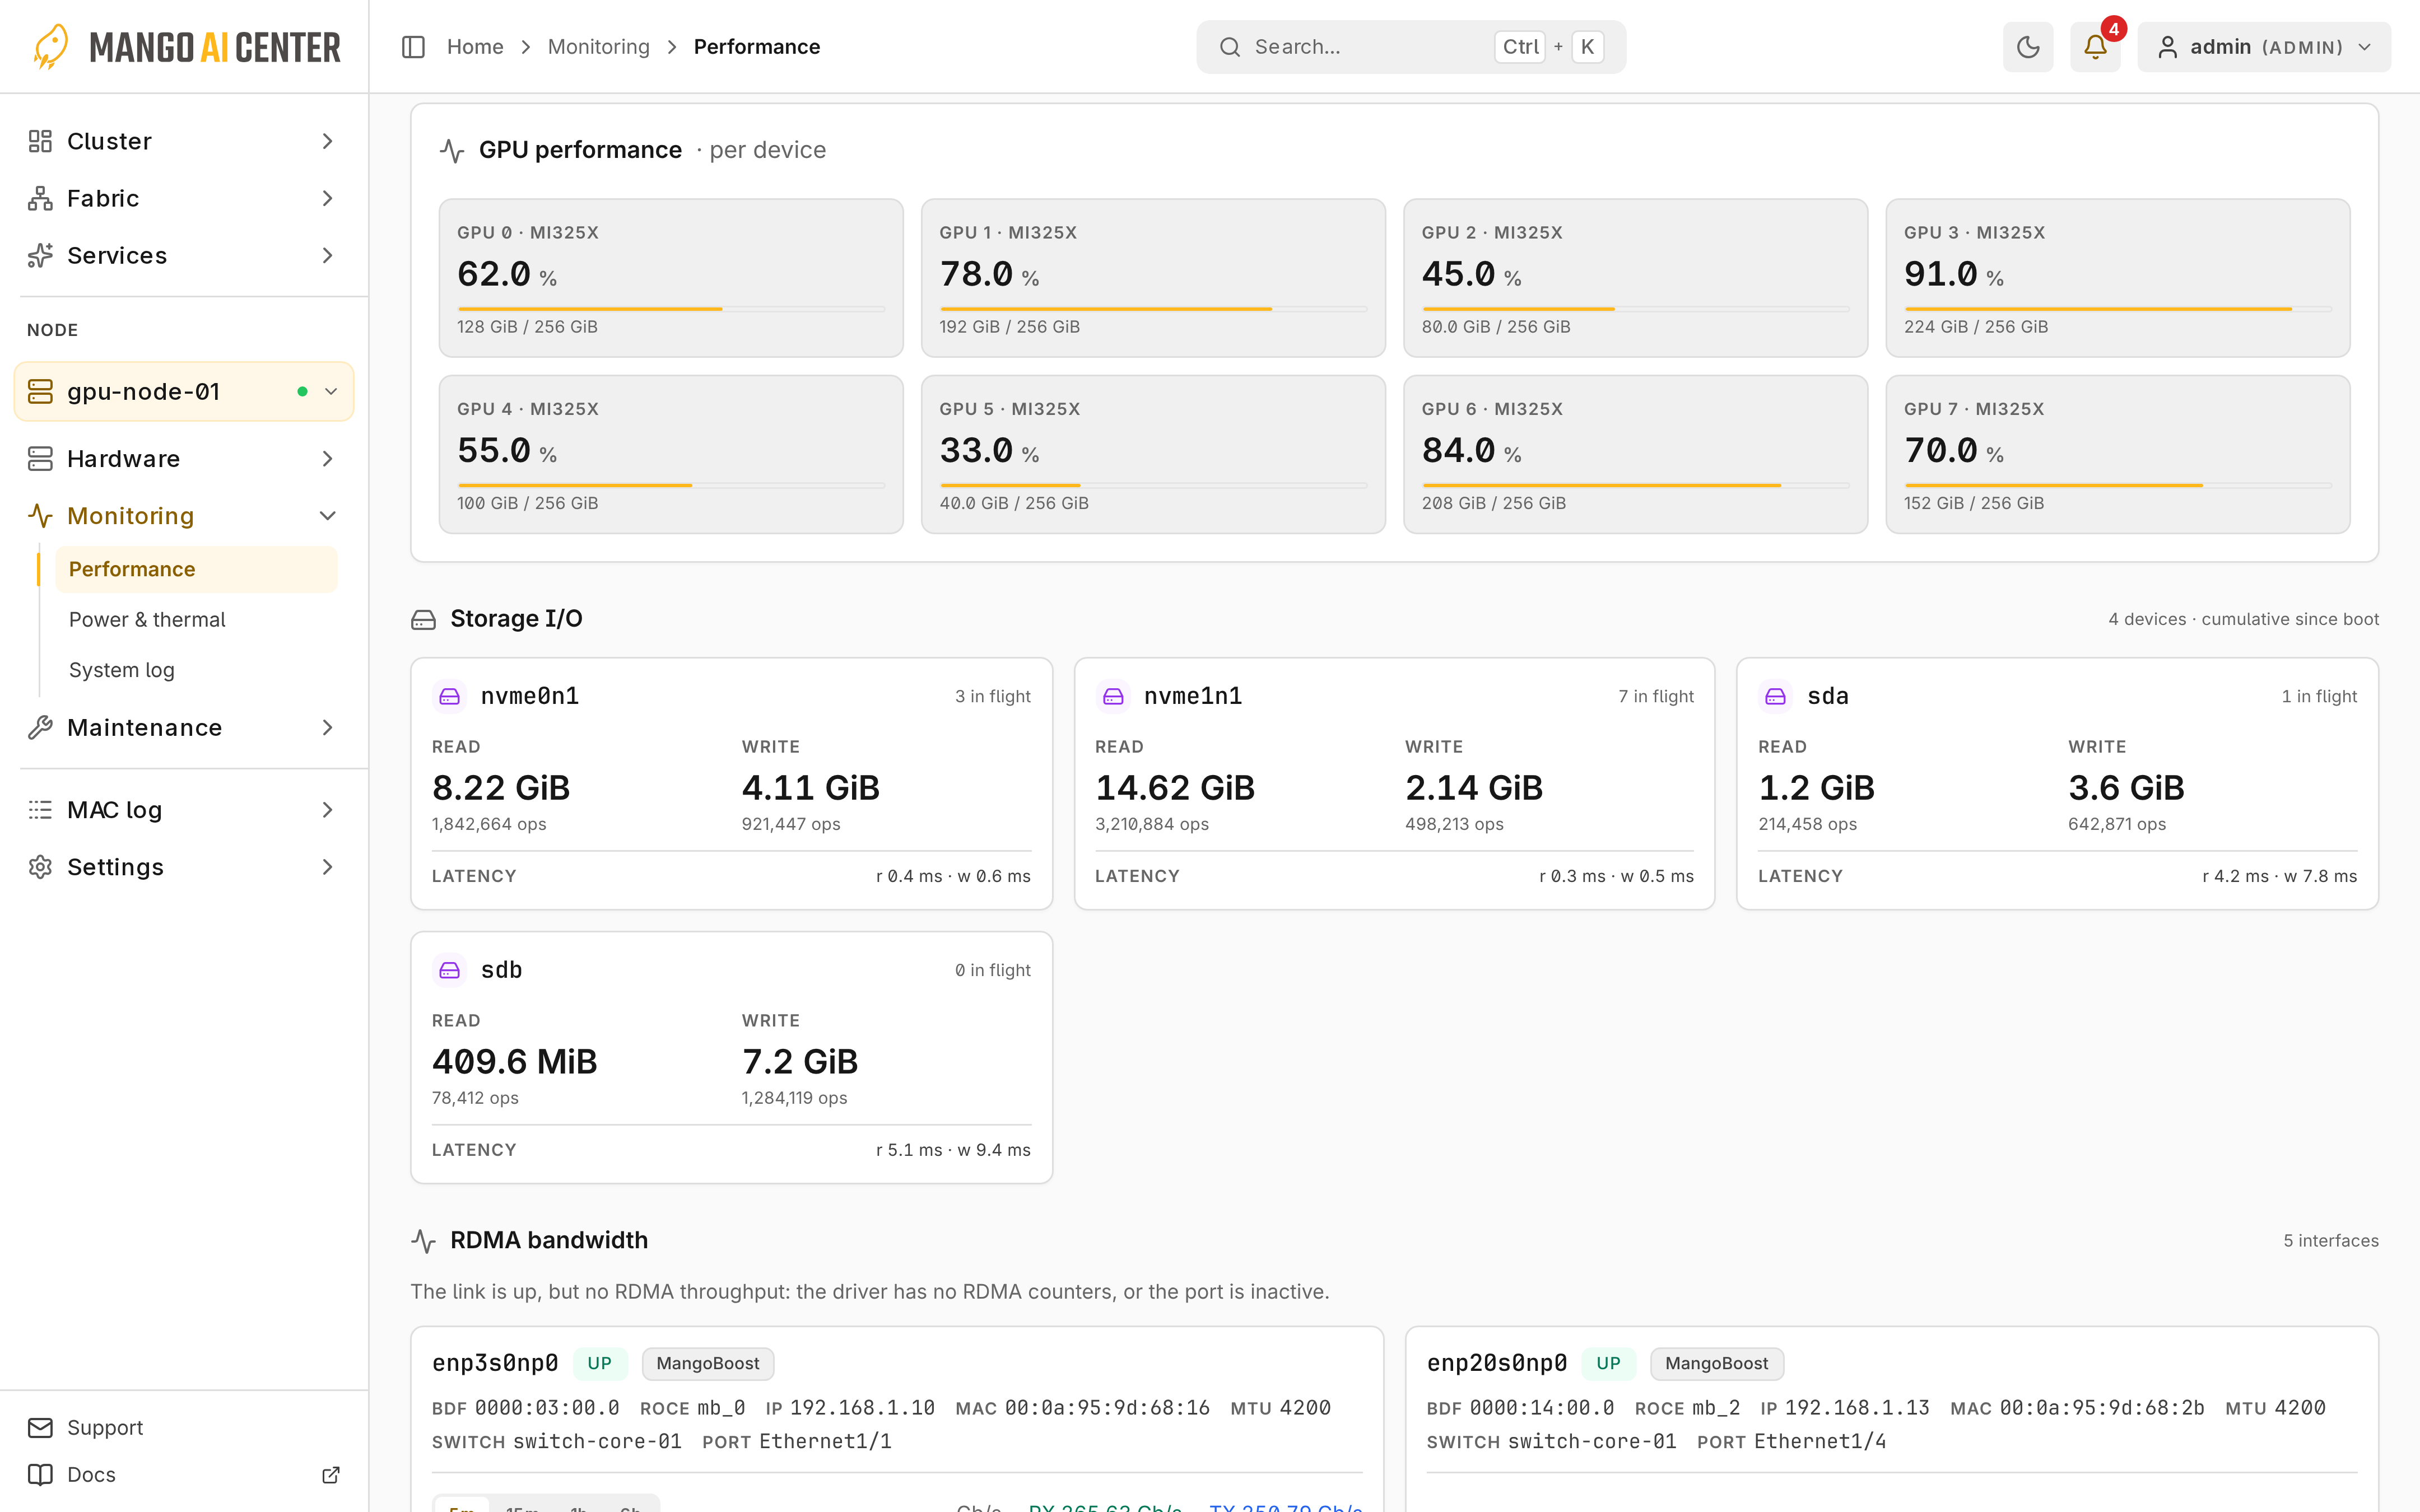
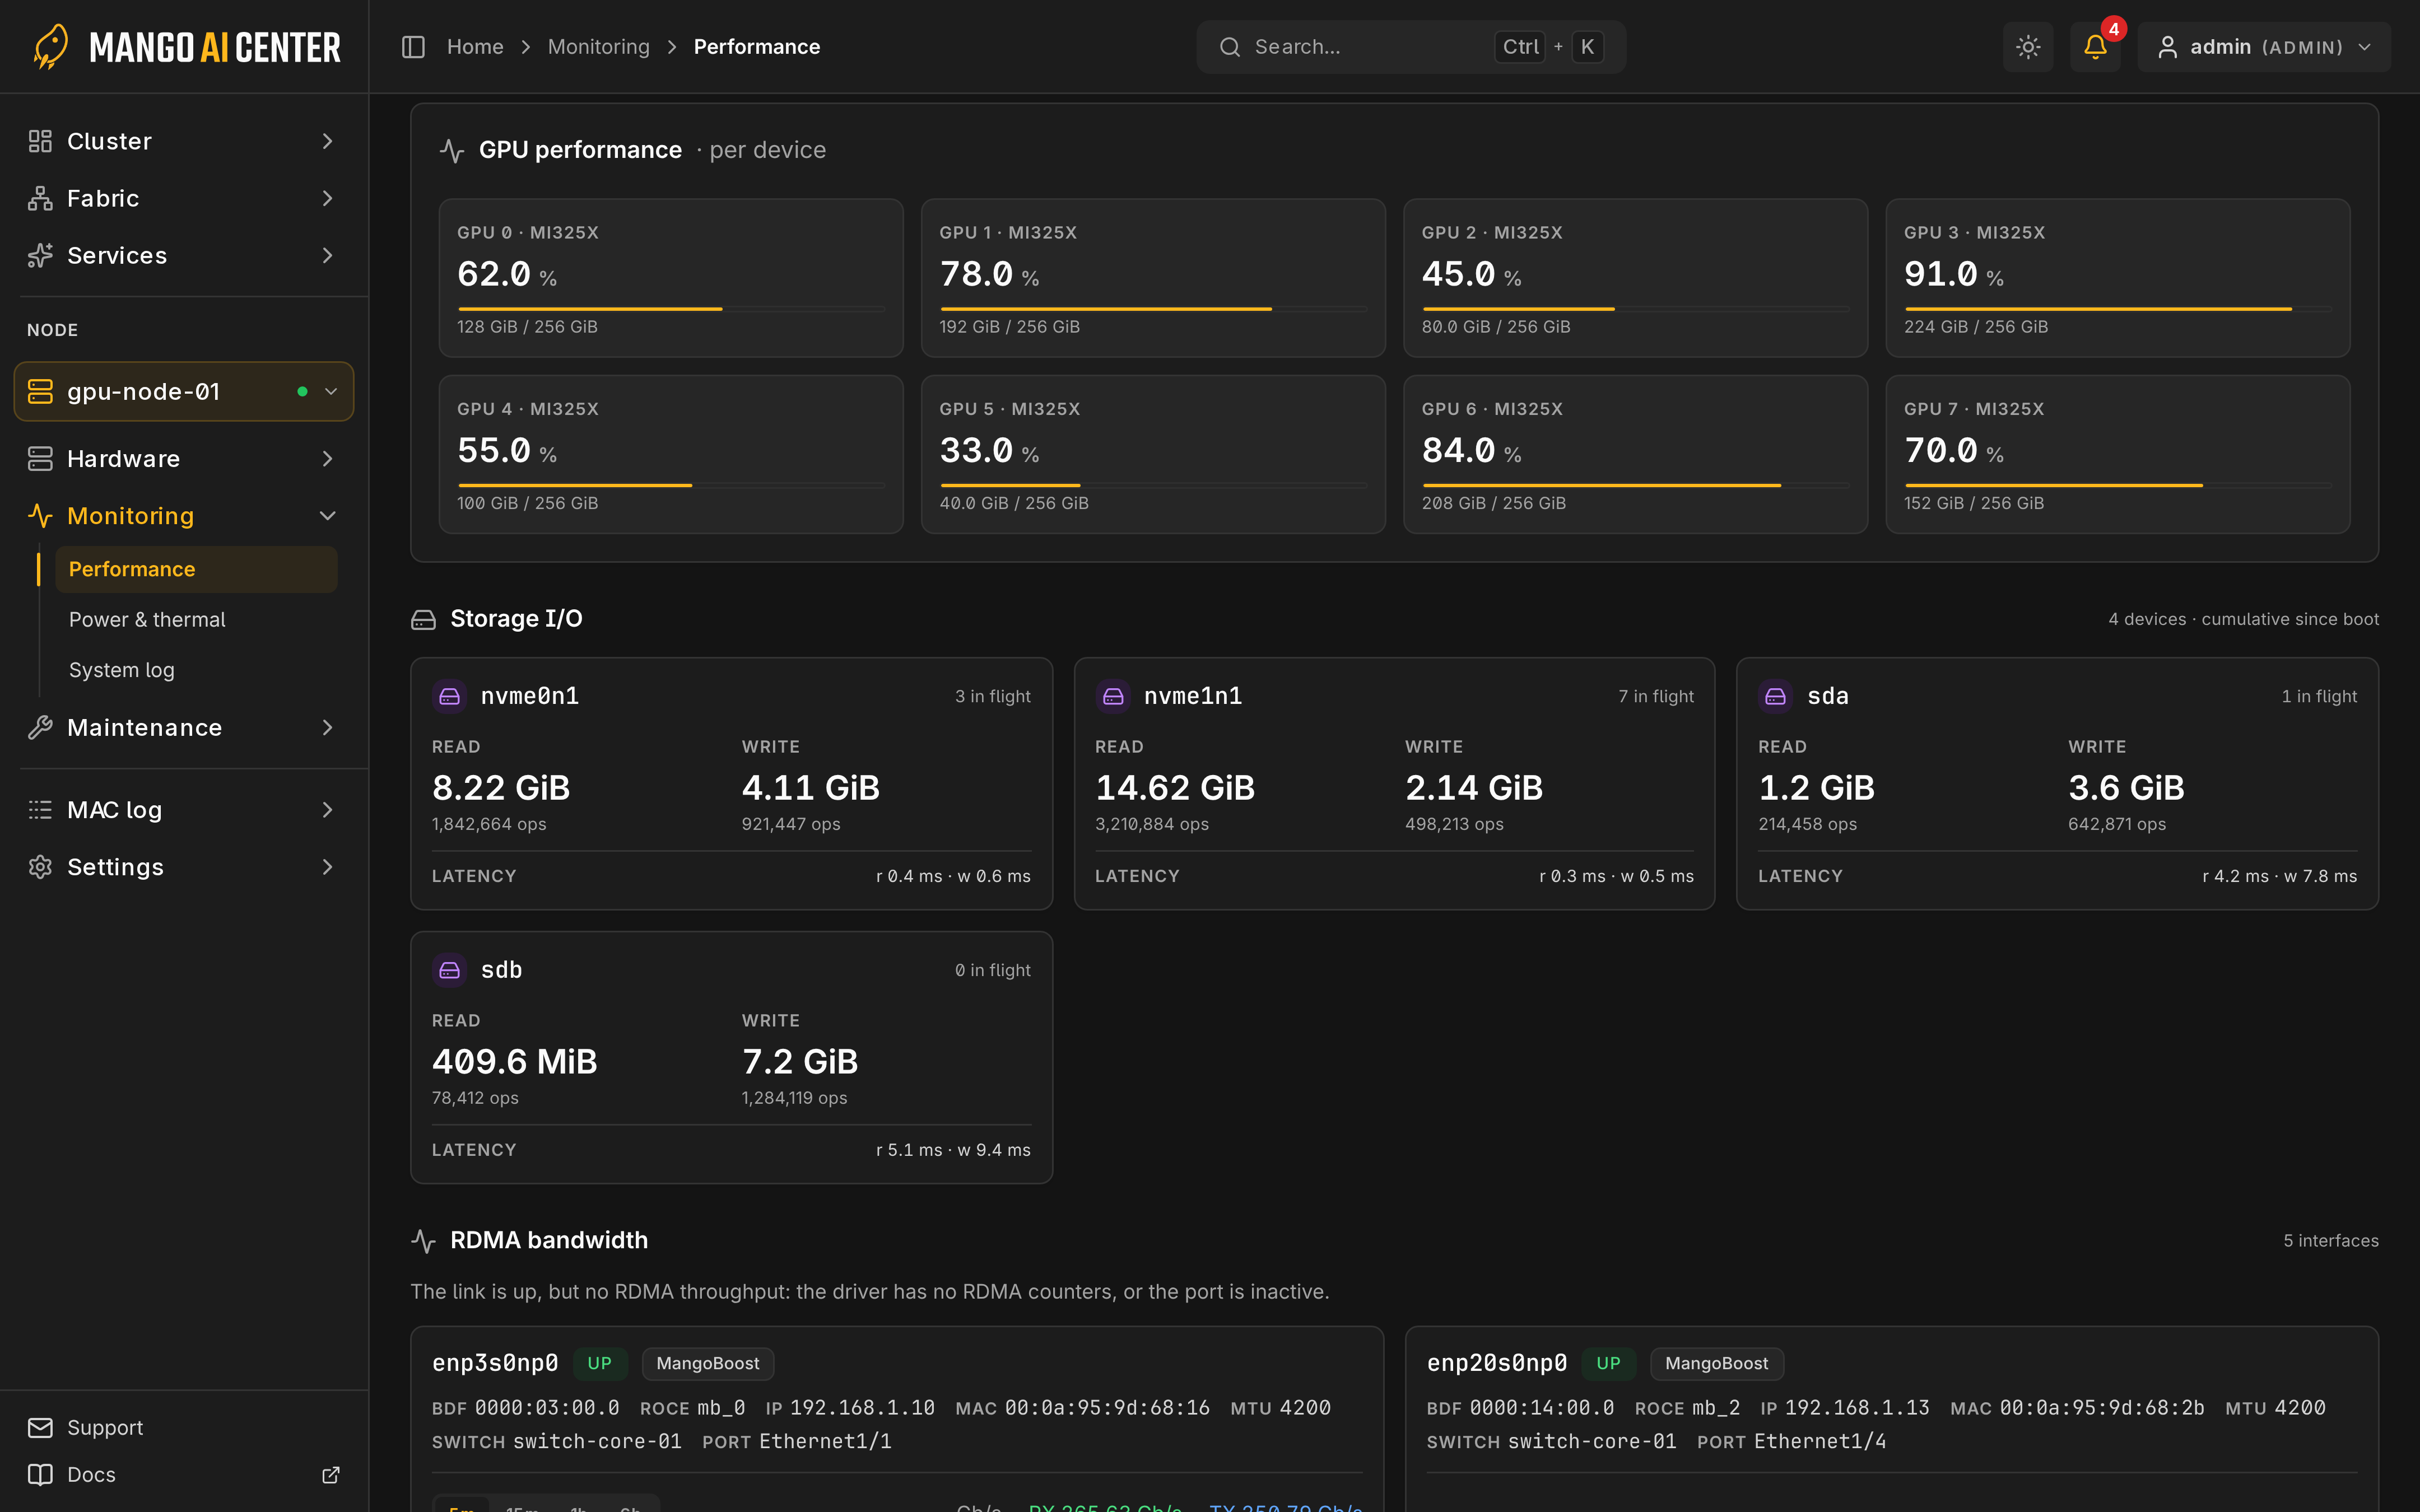
Storage I/O
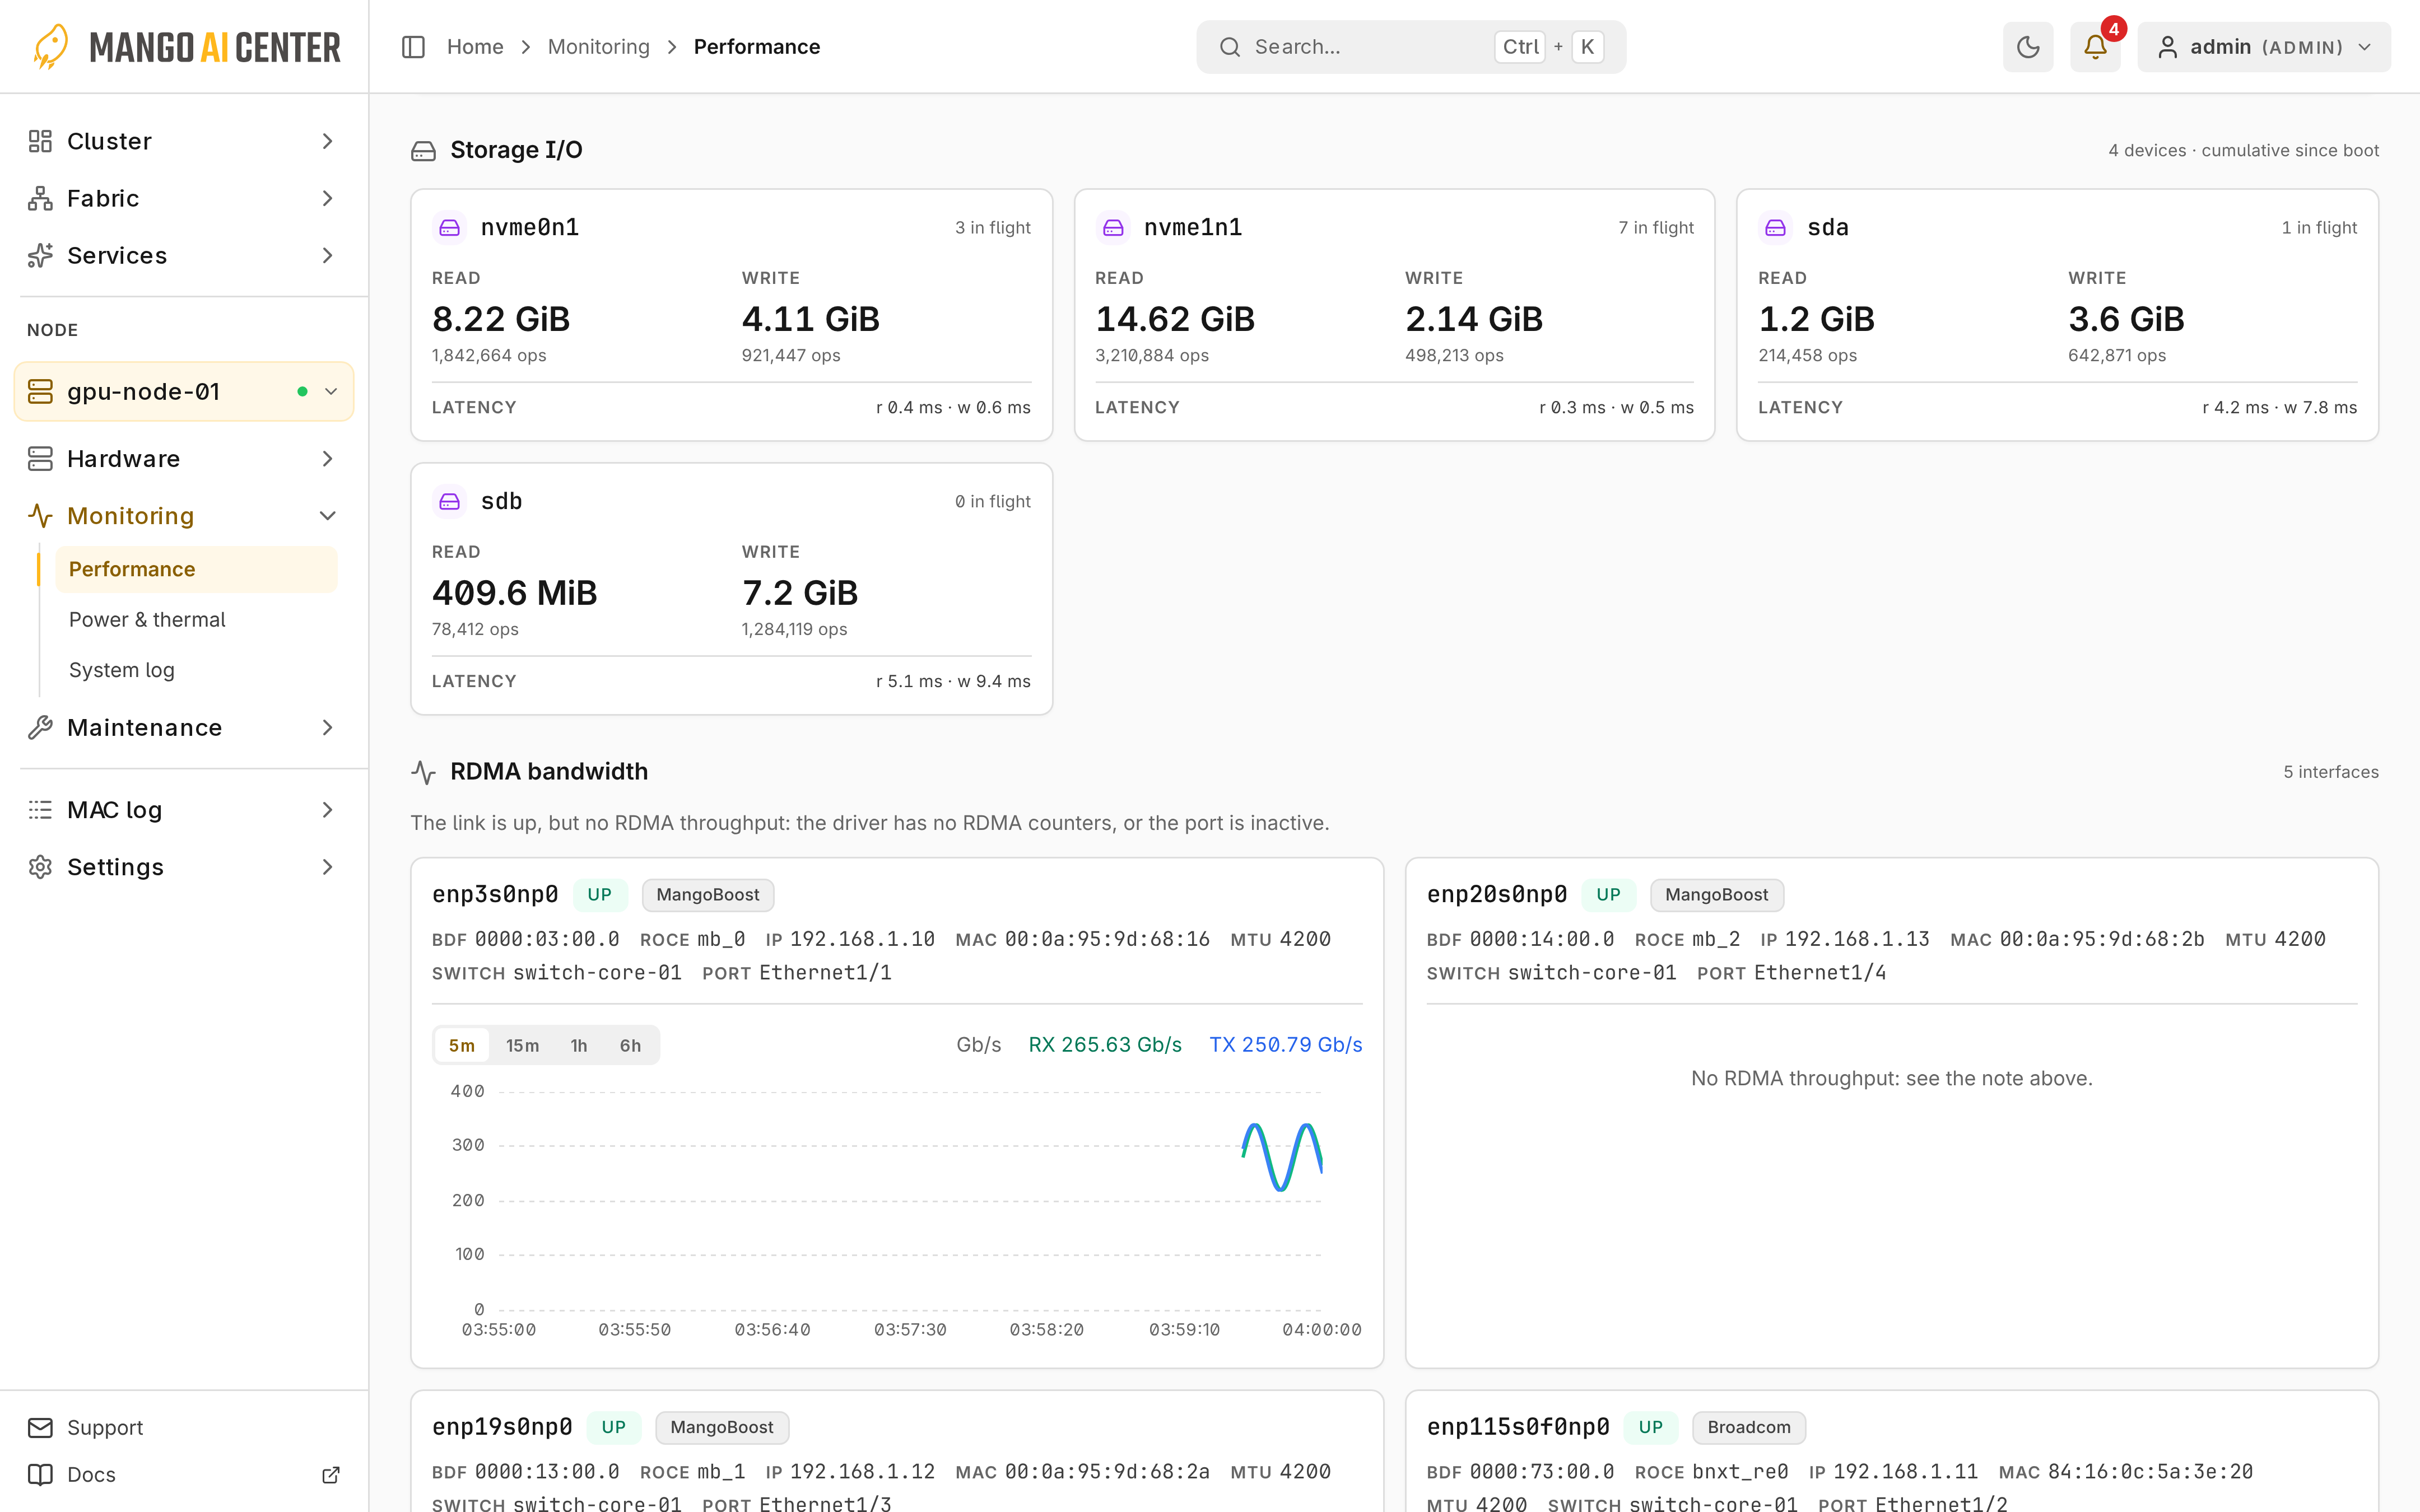
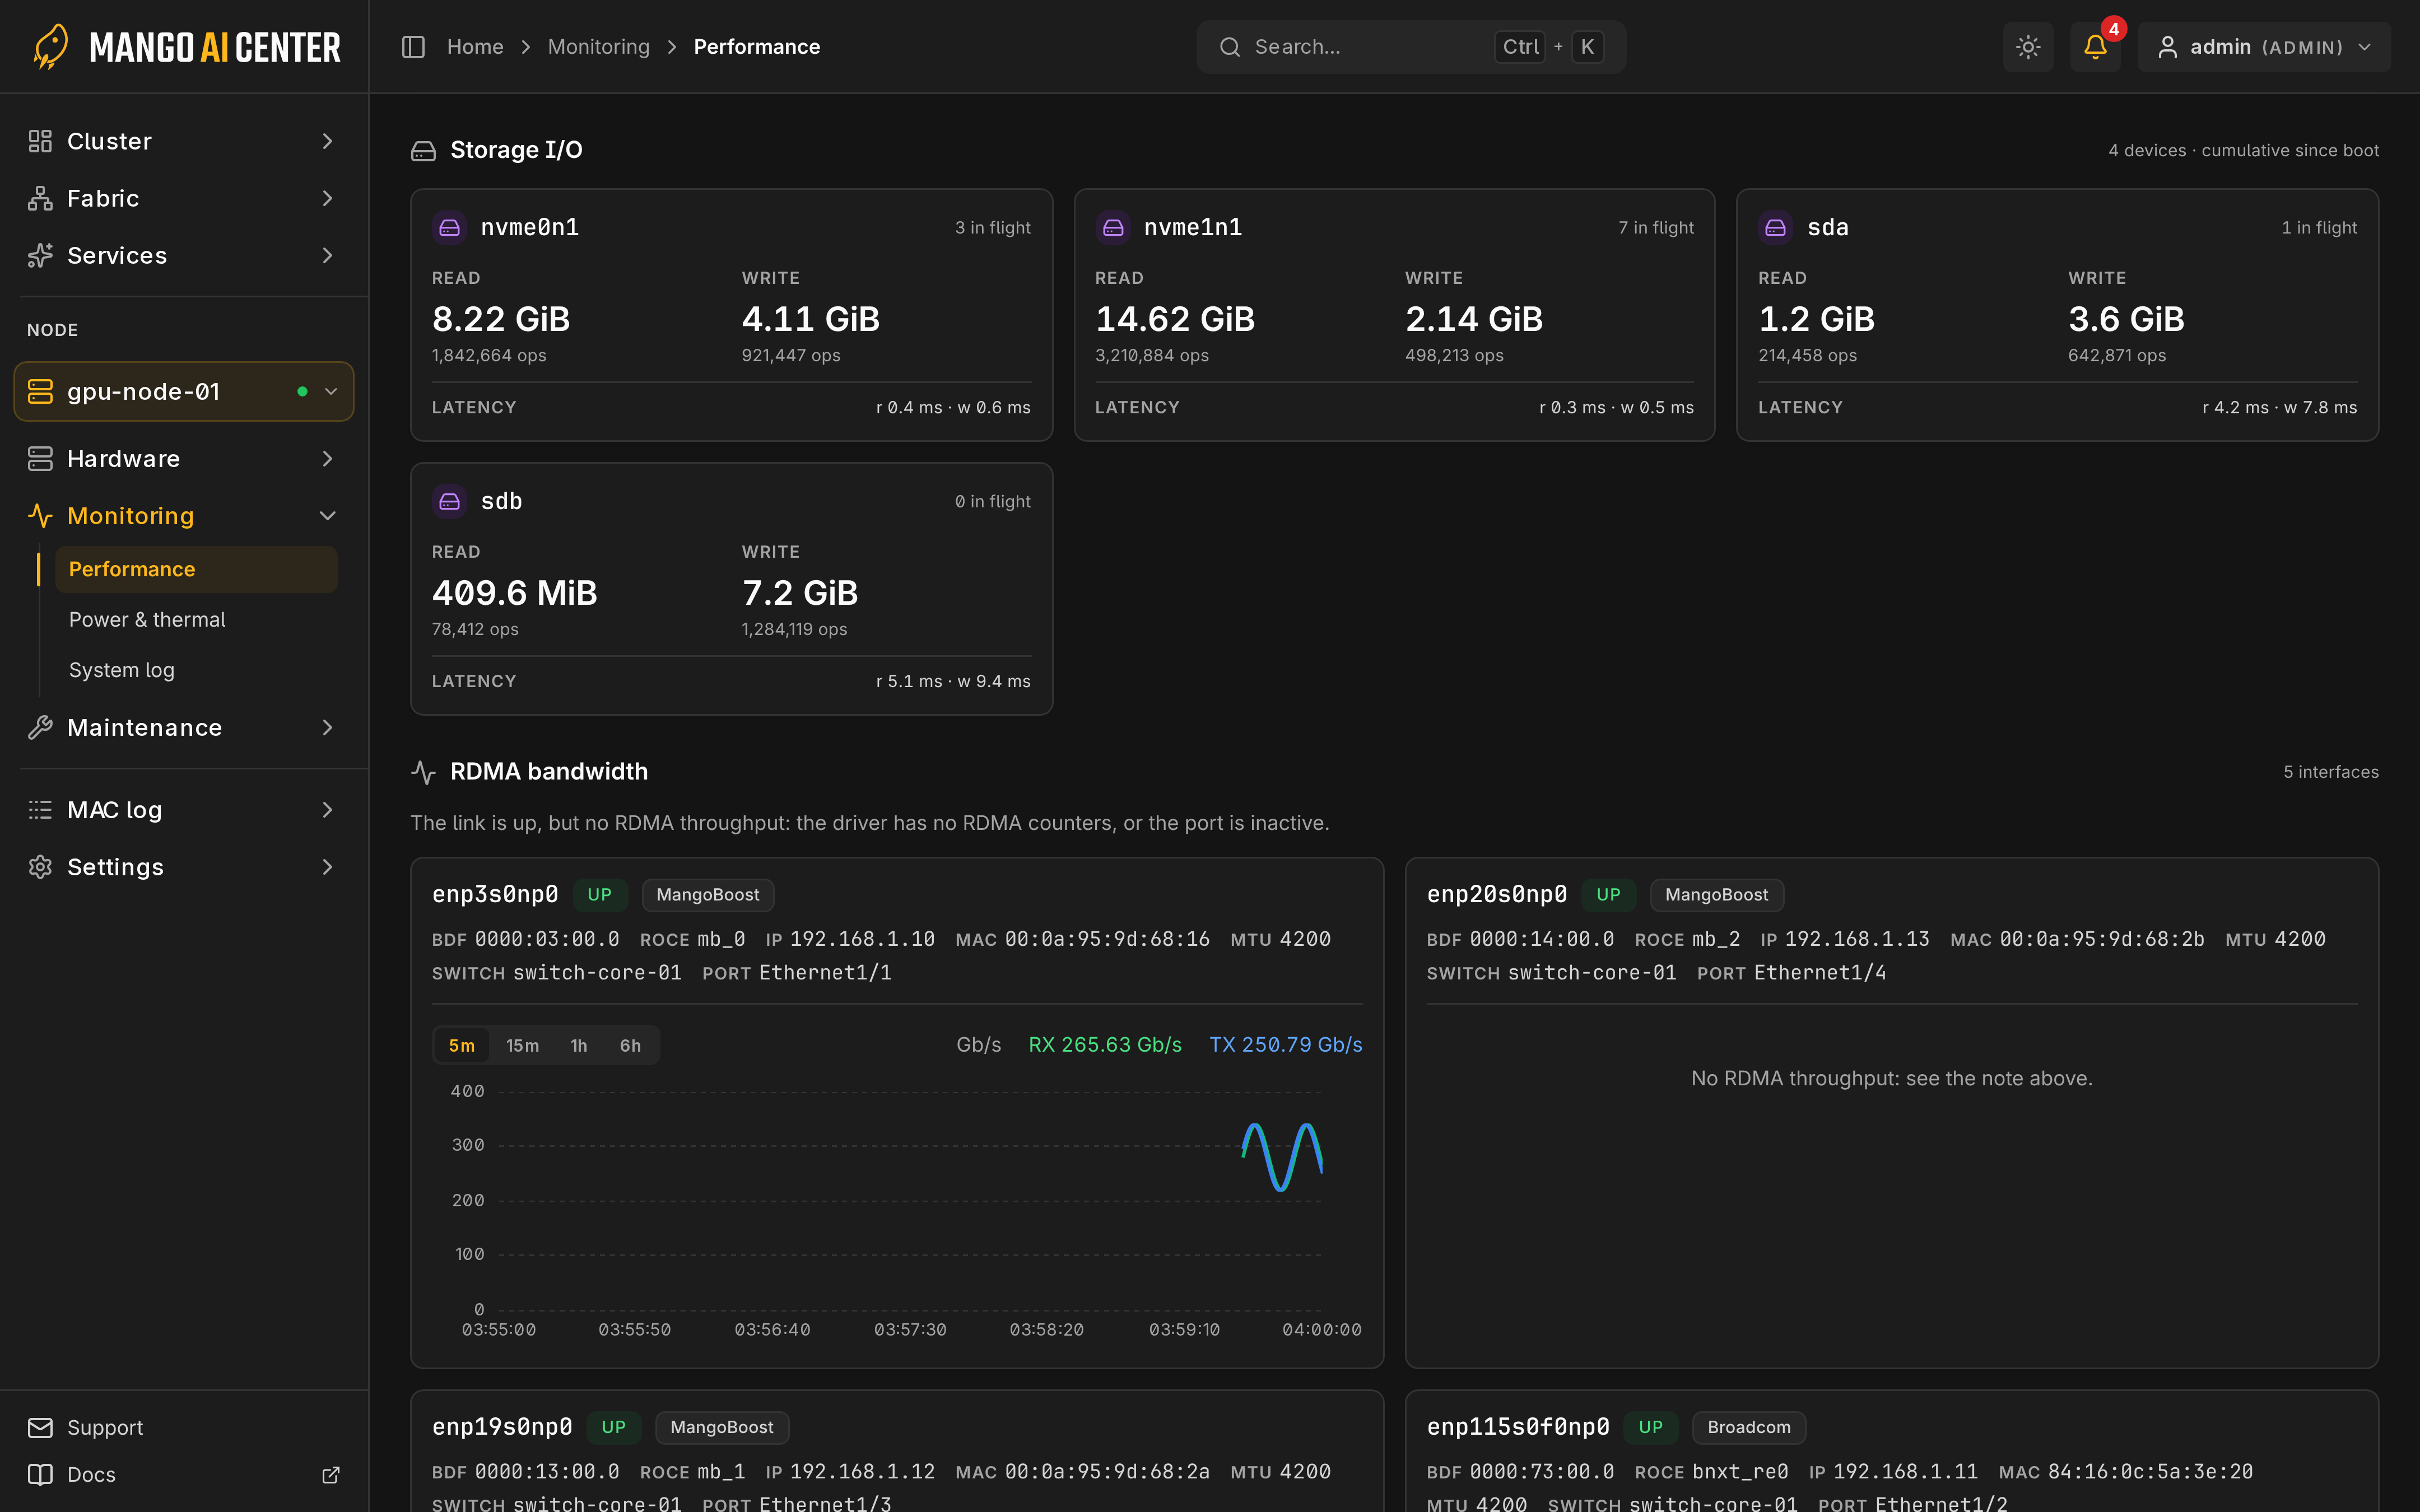
Per-device throughput, IOPS, latency and queue depth. Free capacity is on Storage.
RDMA bandwidth
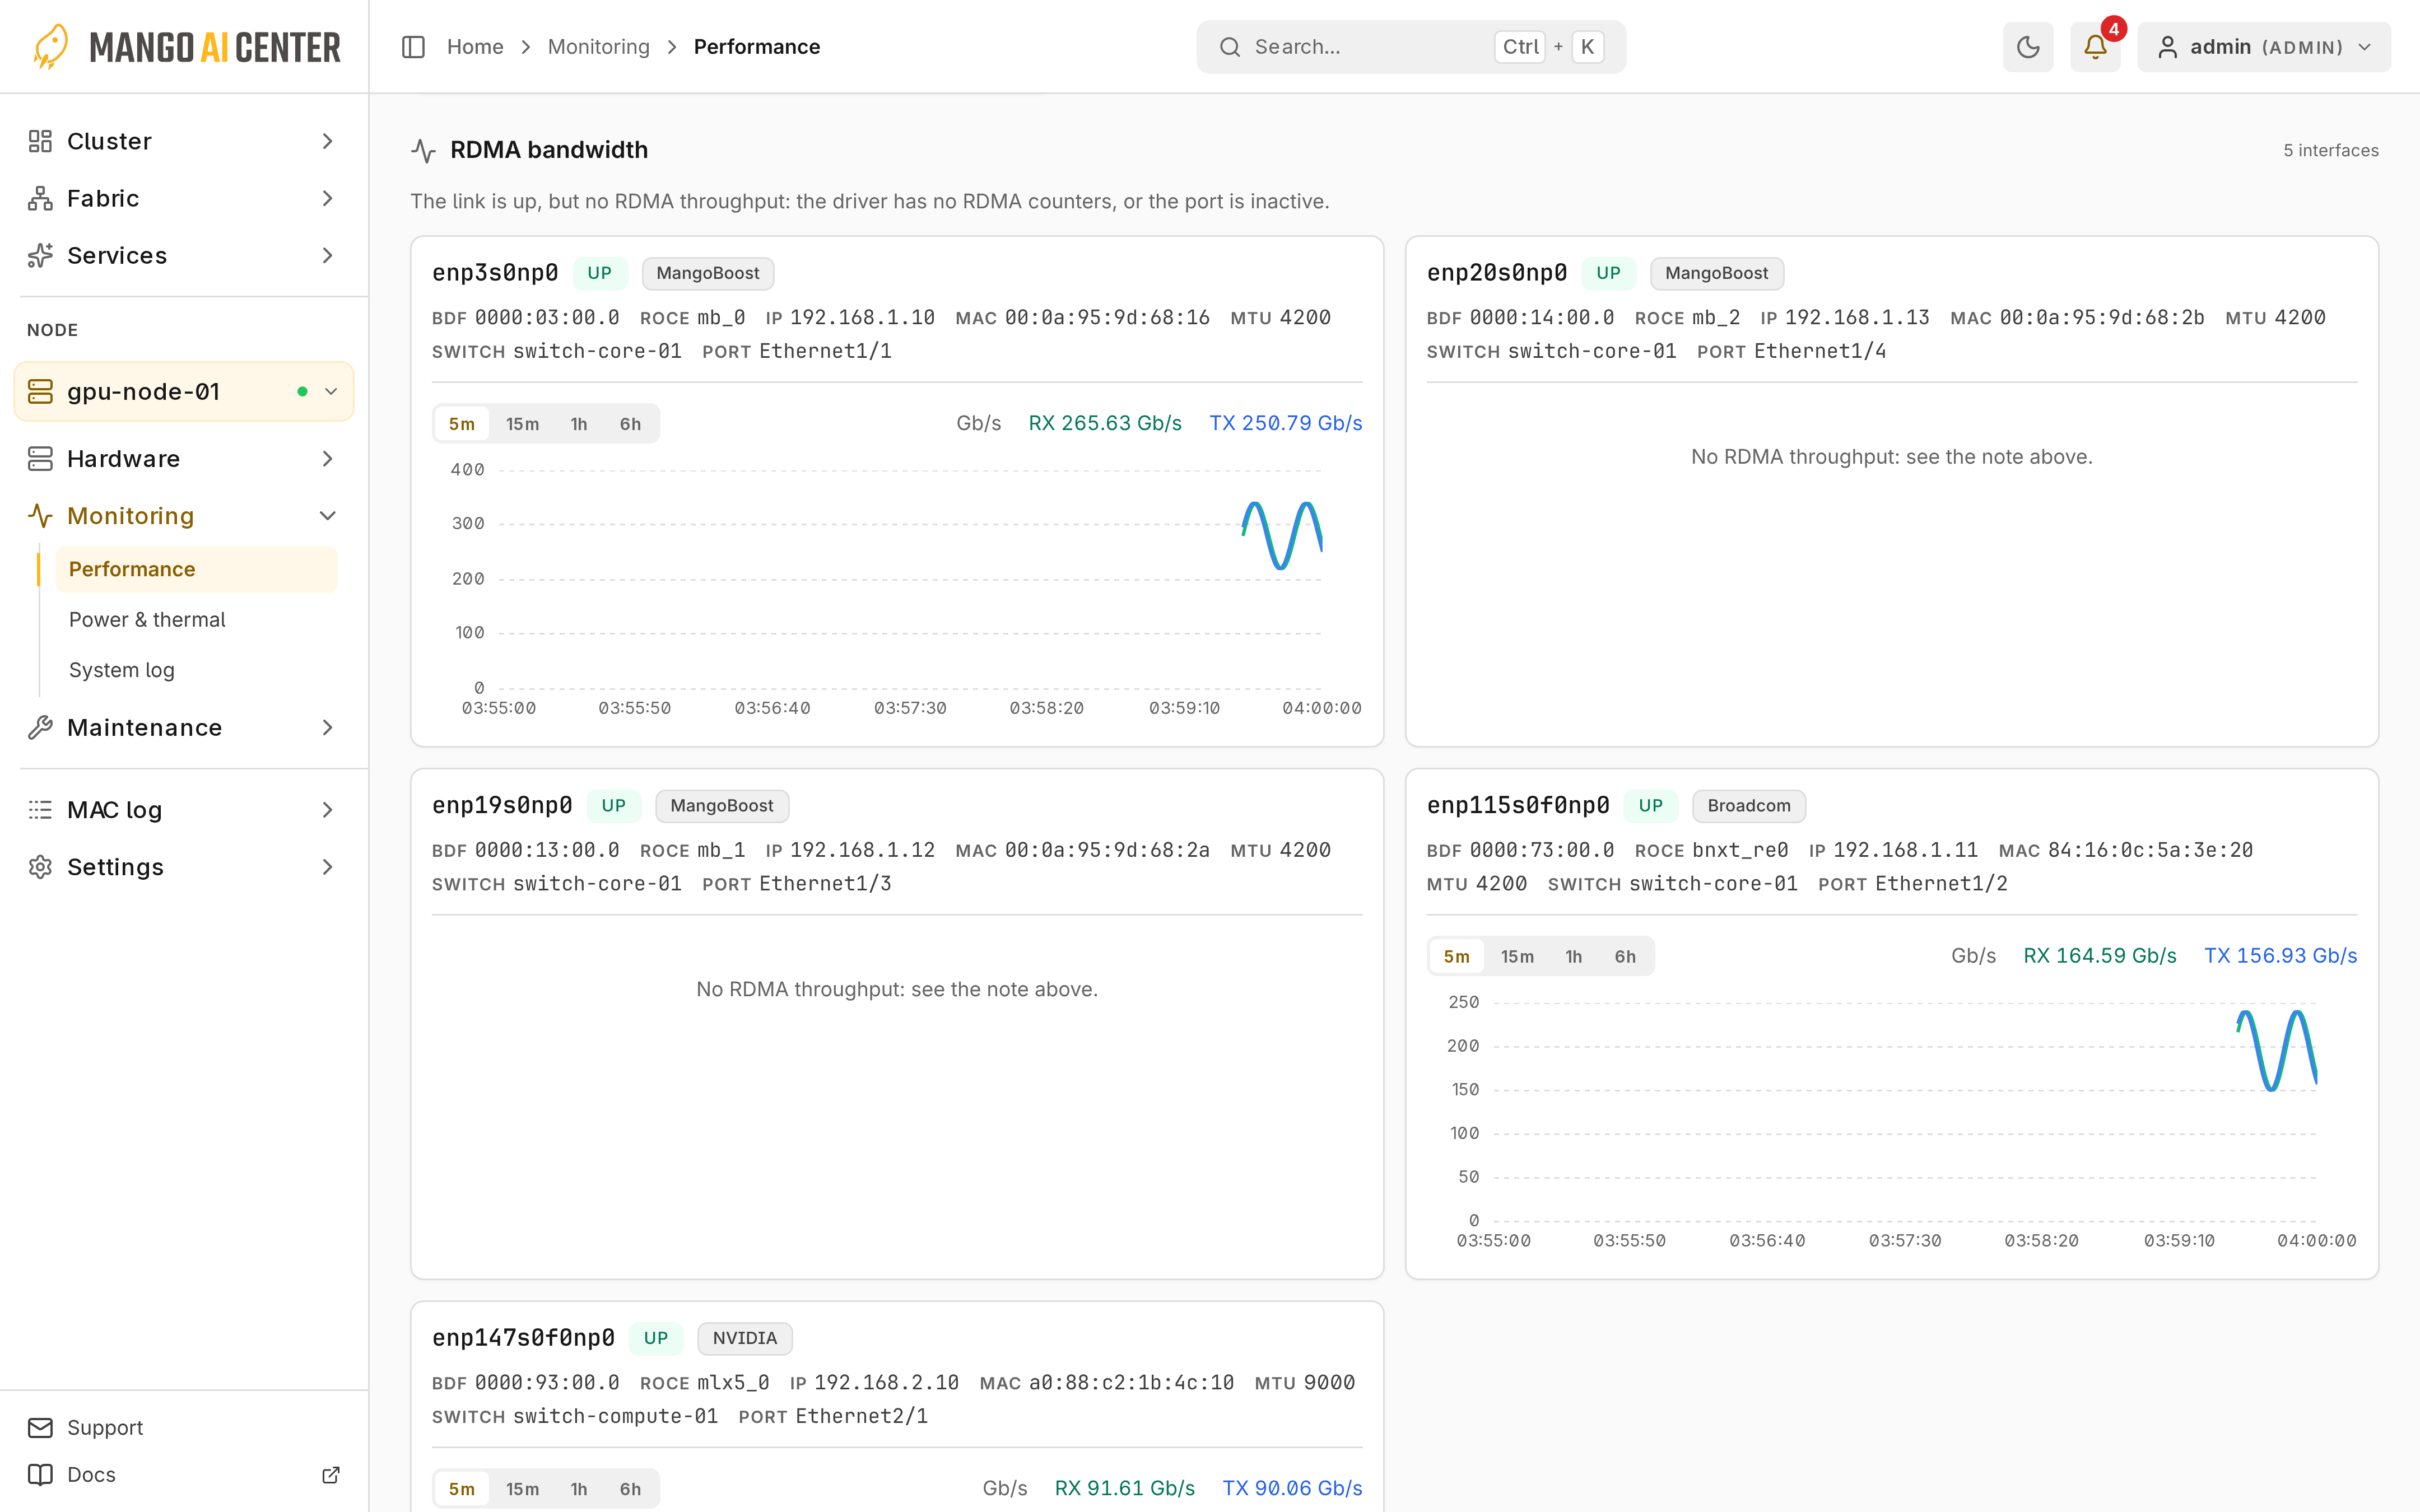
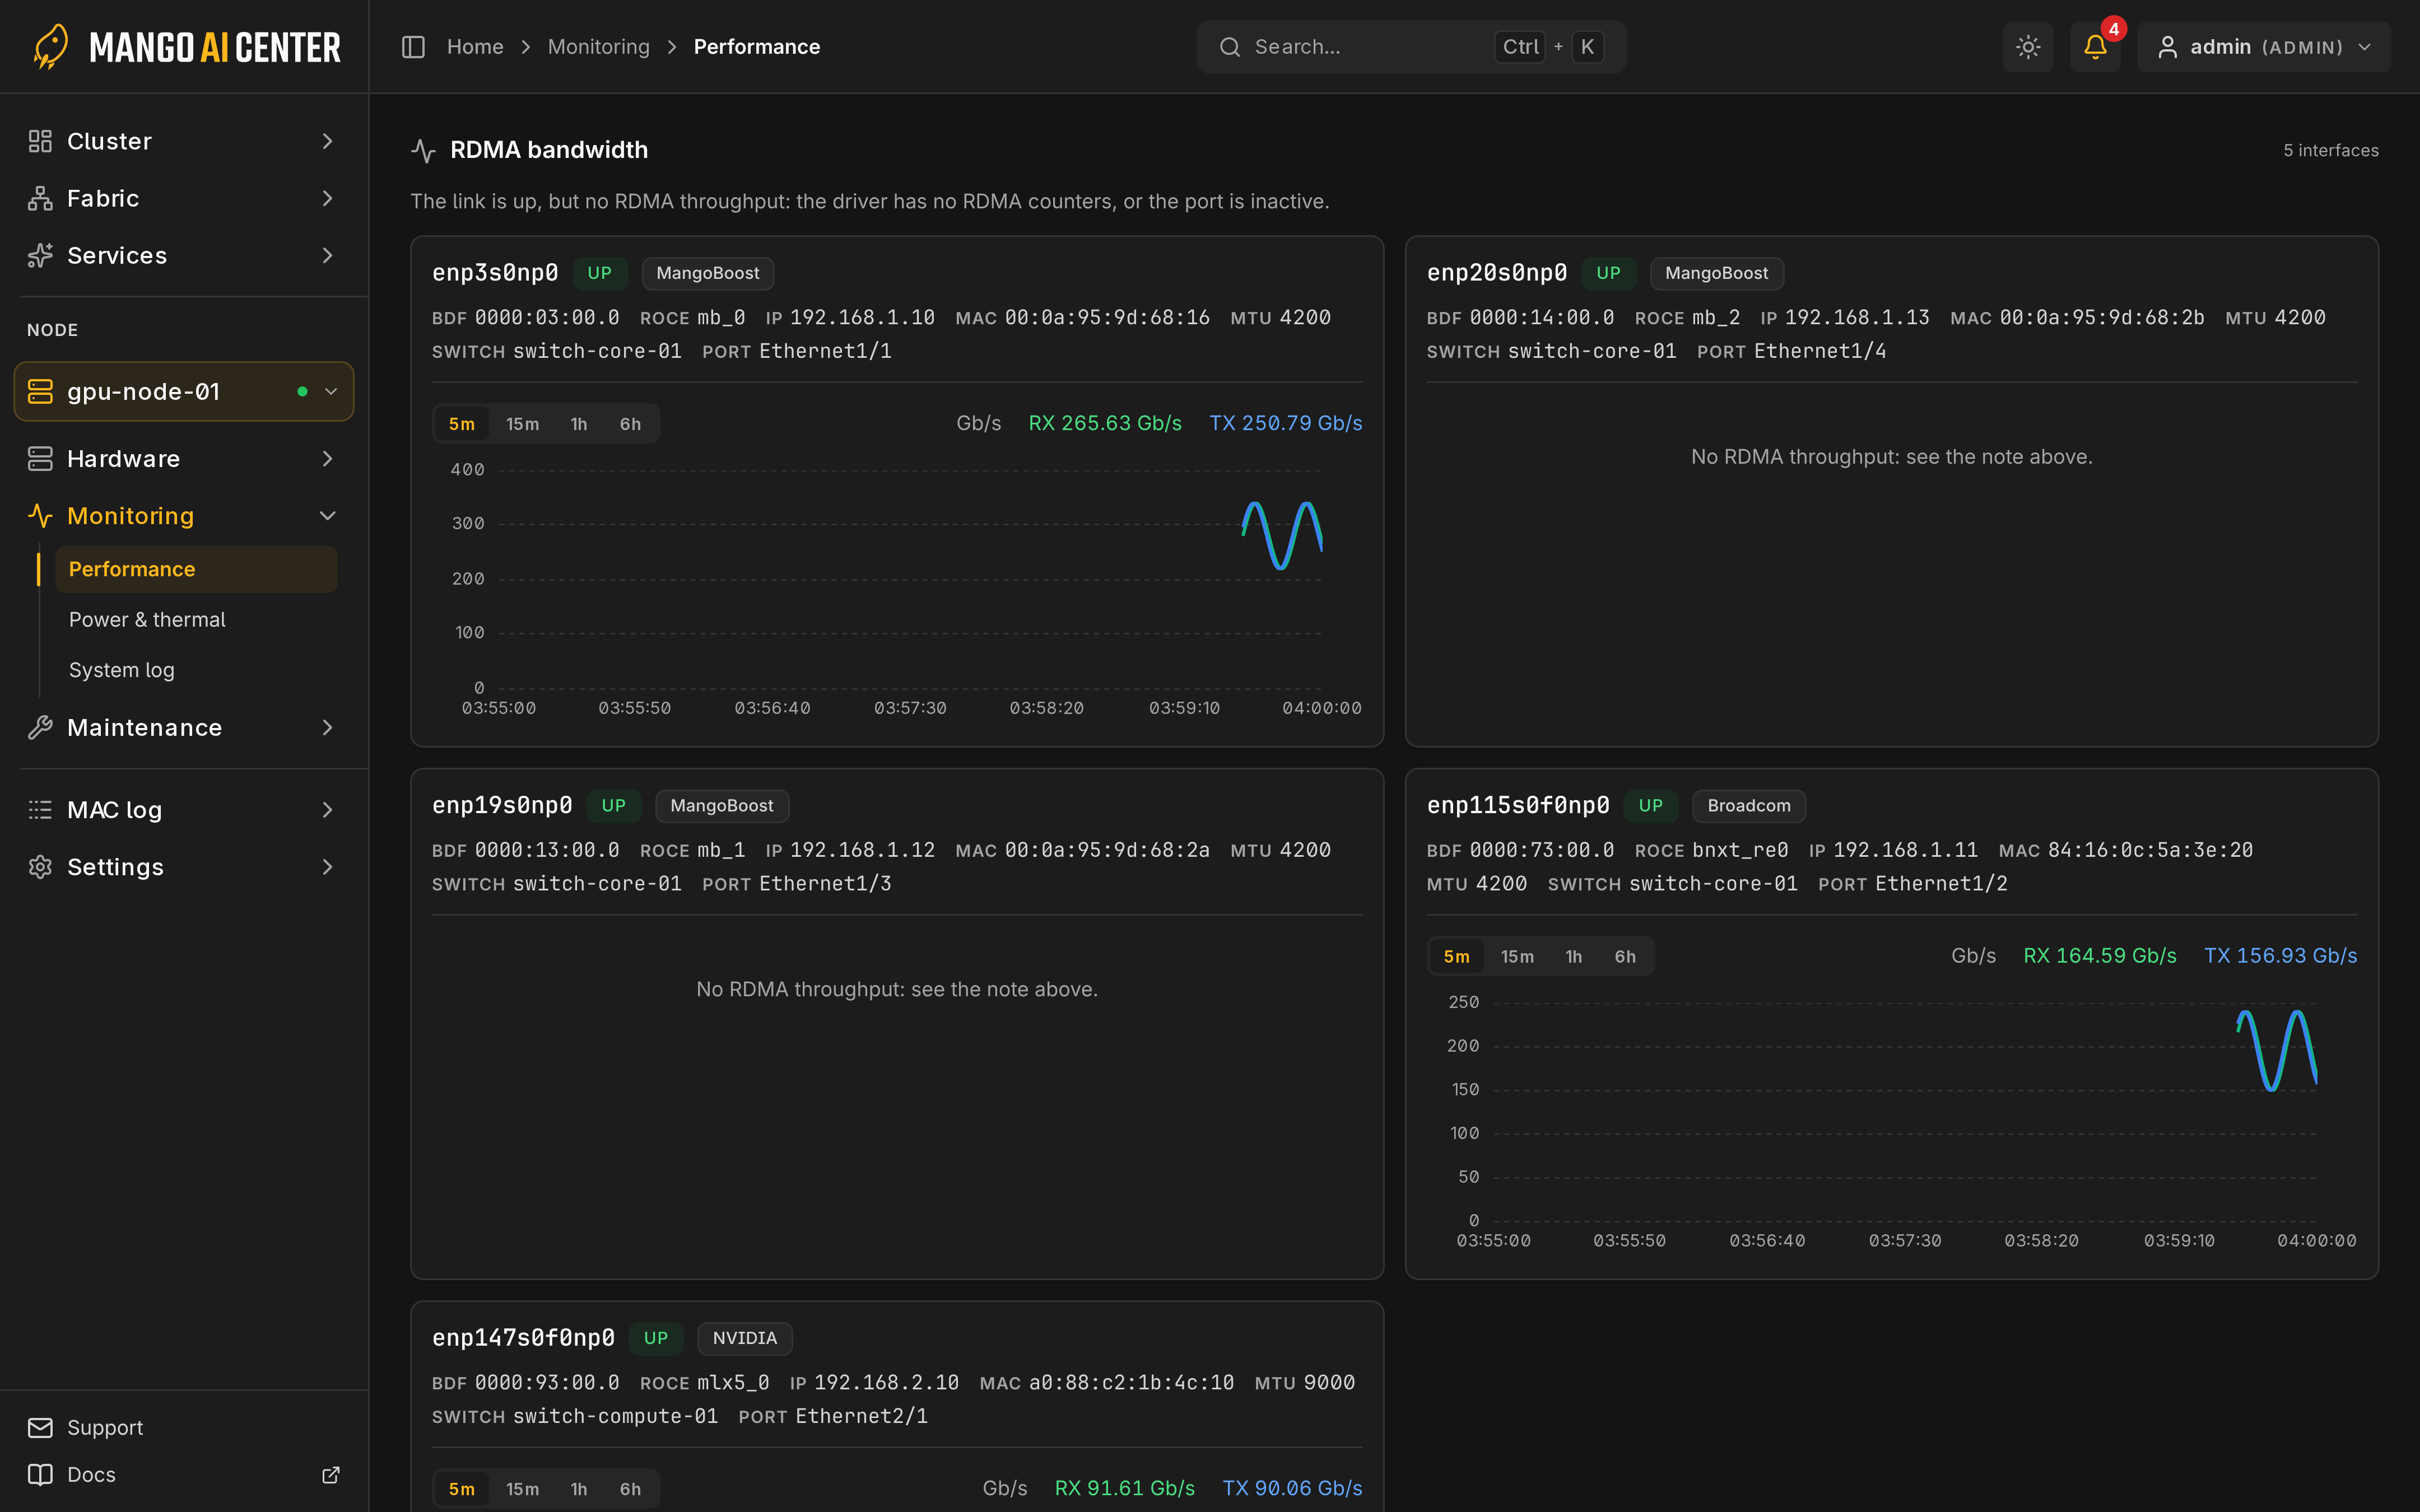
RX/TX per RDMA port, with its own time range. Compare traffic with link speed.
Data Availability
An empty chart means no data was collected, not zero activity; see MAC service logs.