Mango AI Center
Mango AI Center (MAC) is a unified management platform for AI server fleets equipped with GPUs, DPUs, RDMA NICs, and high-speed Ethernet fabrics. MAC gives operators a single dashboard to monitor hardware health, visualize the network topology, configure switches, manage SDK software on each node, and observe AI inference clusters — without having to SSH into every server.
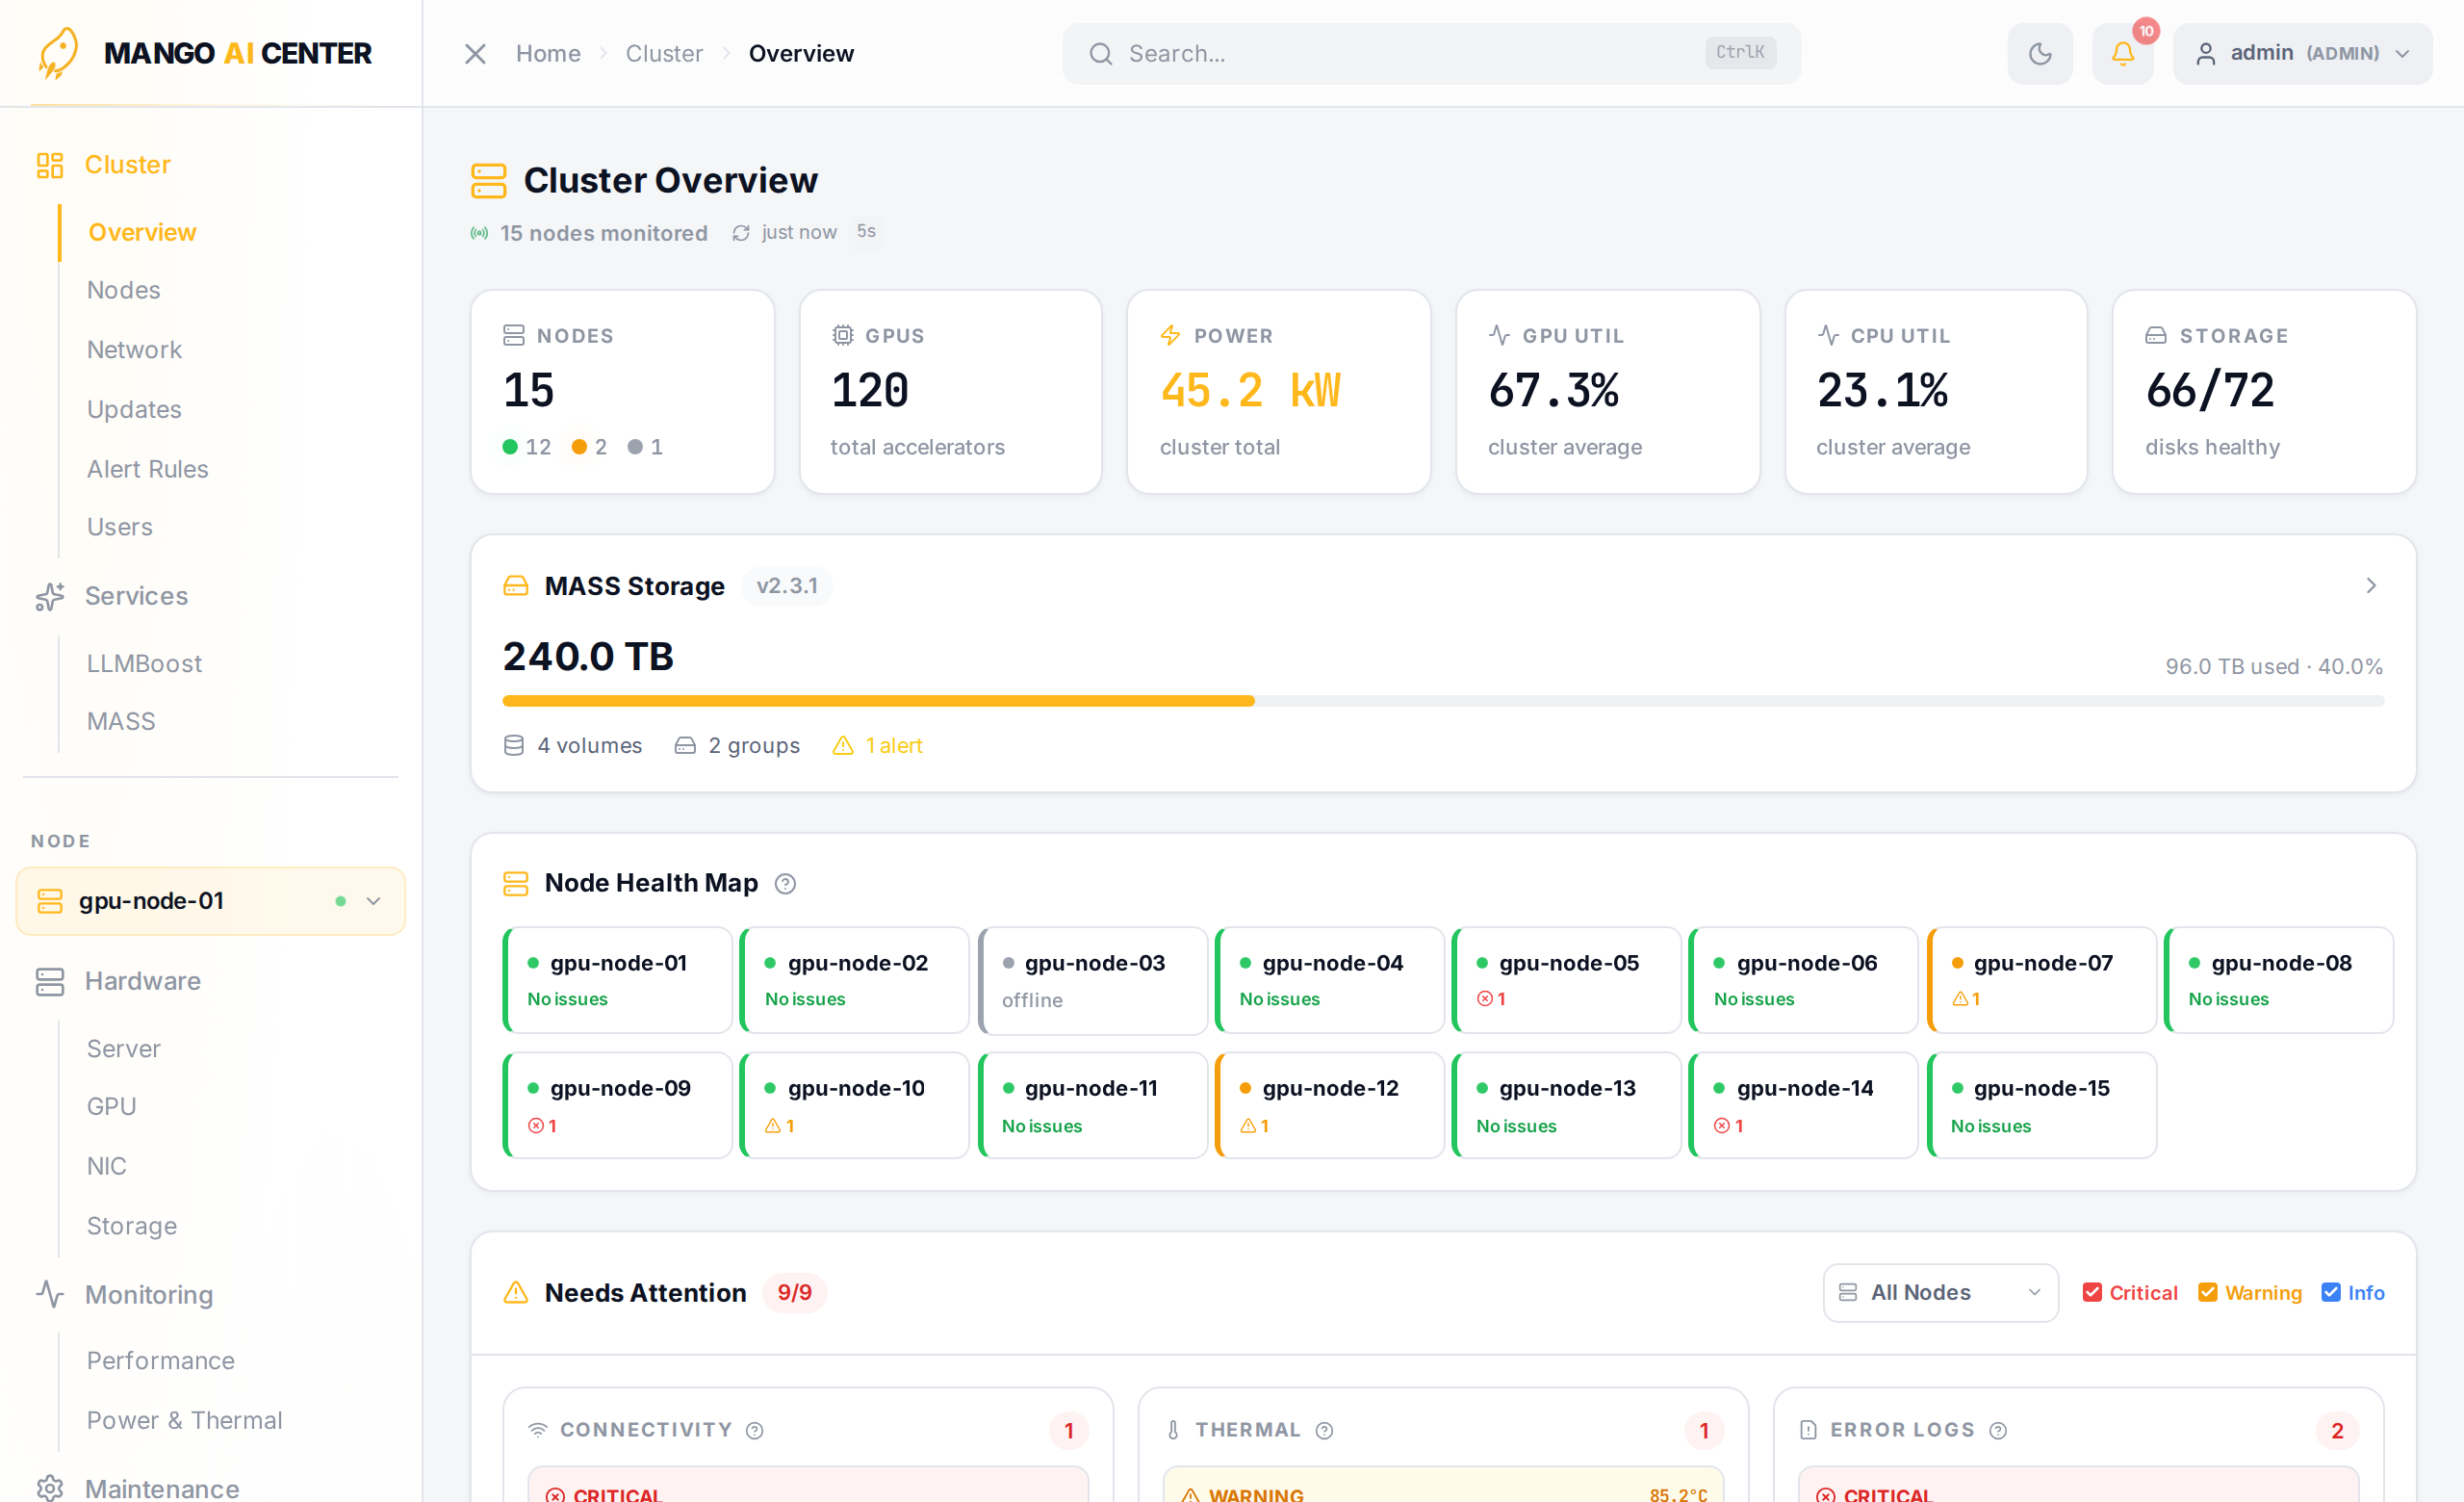
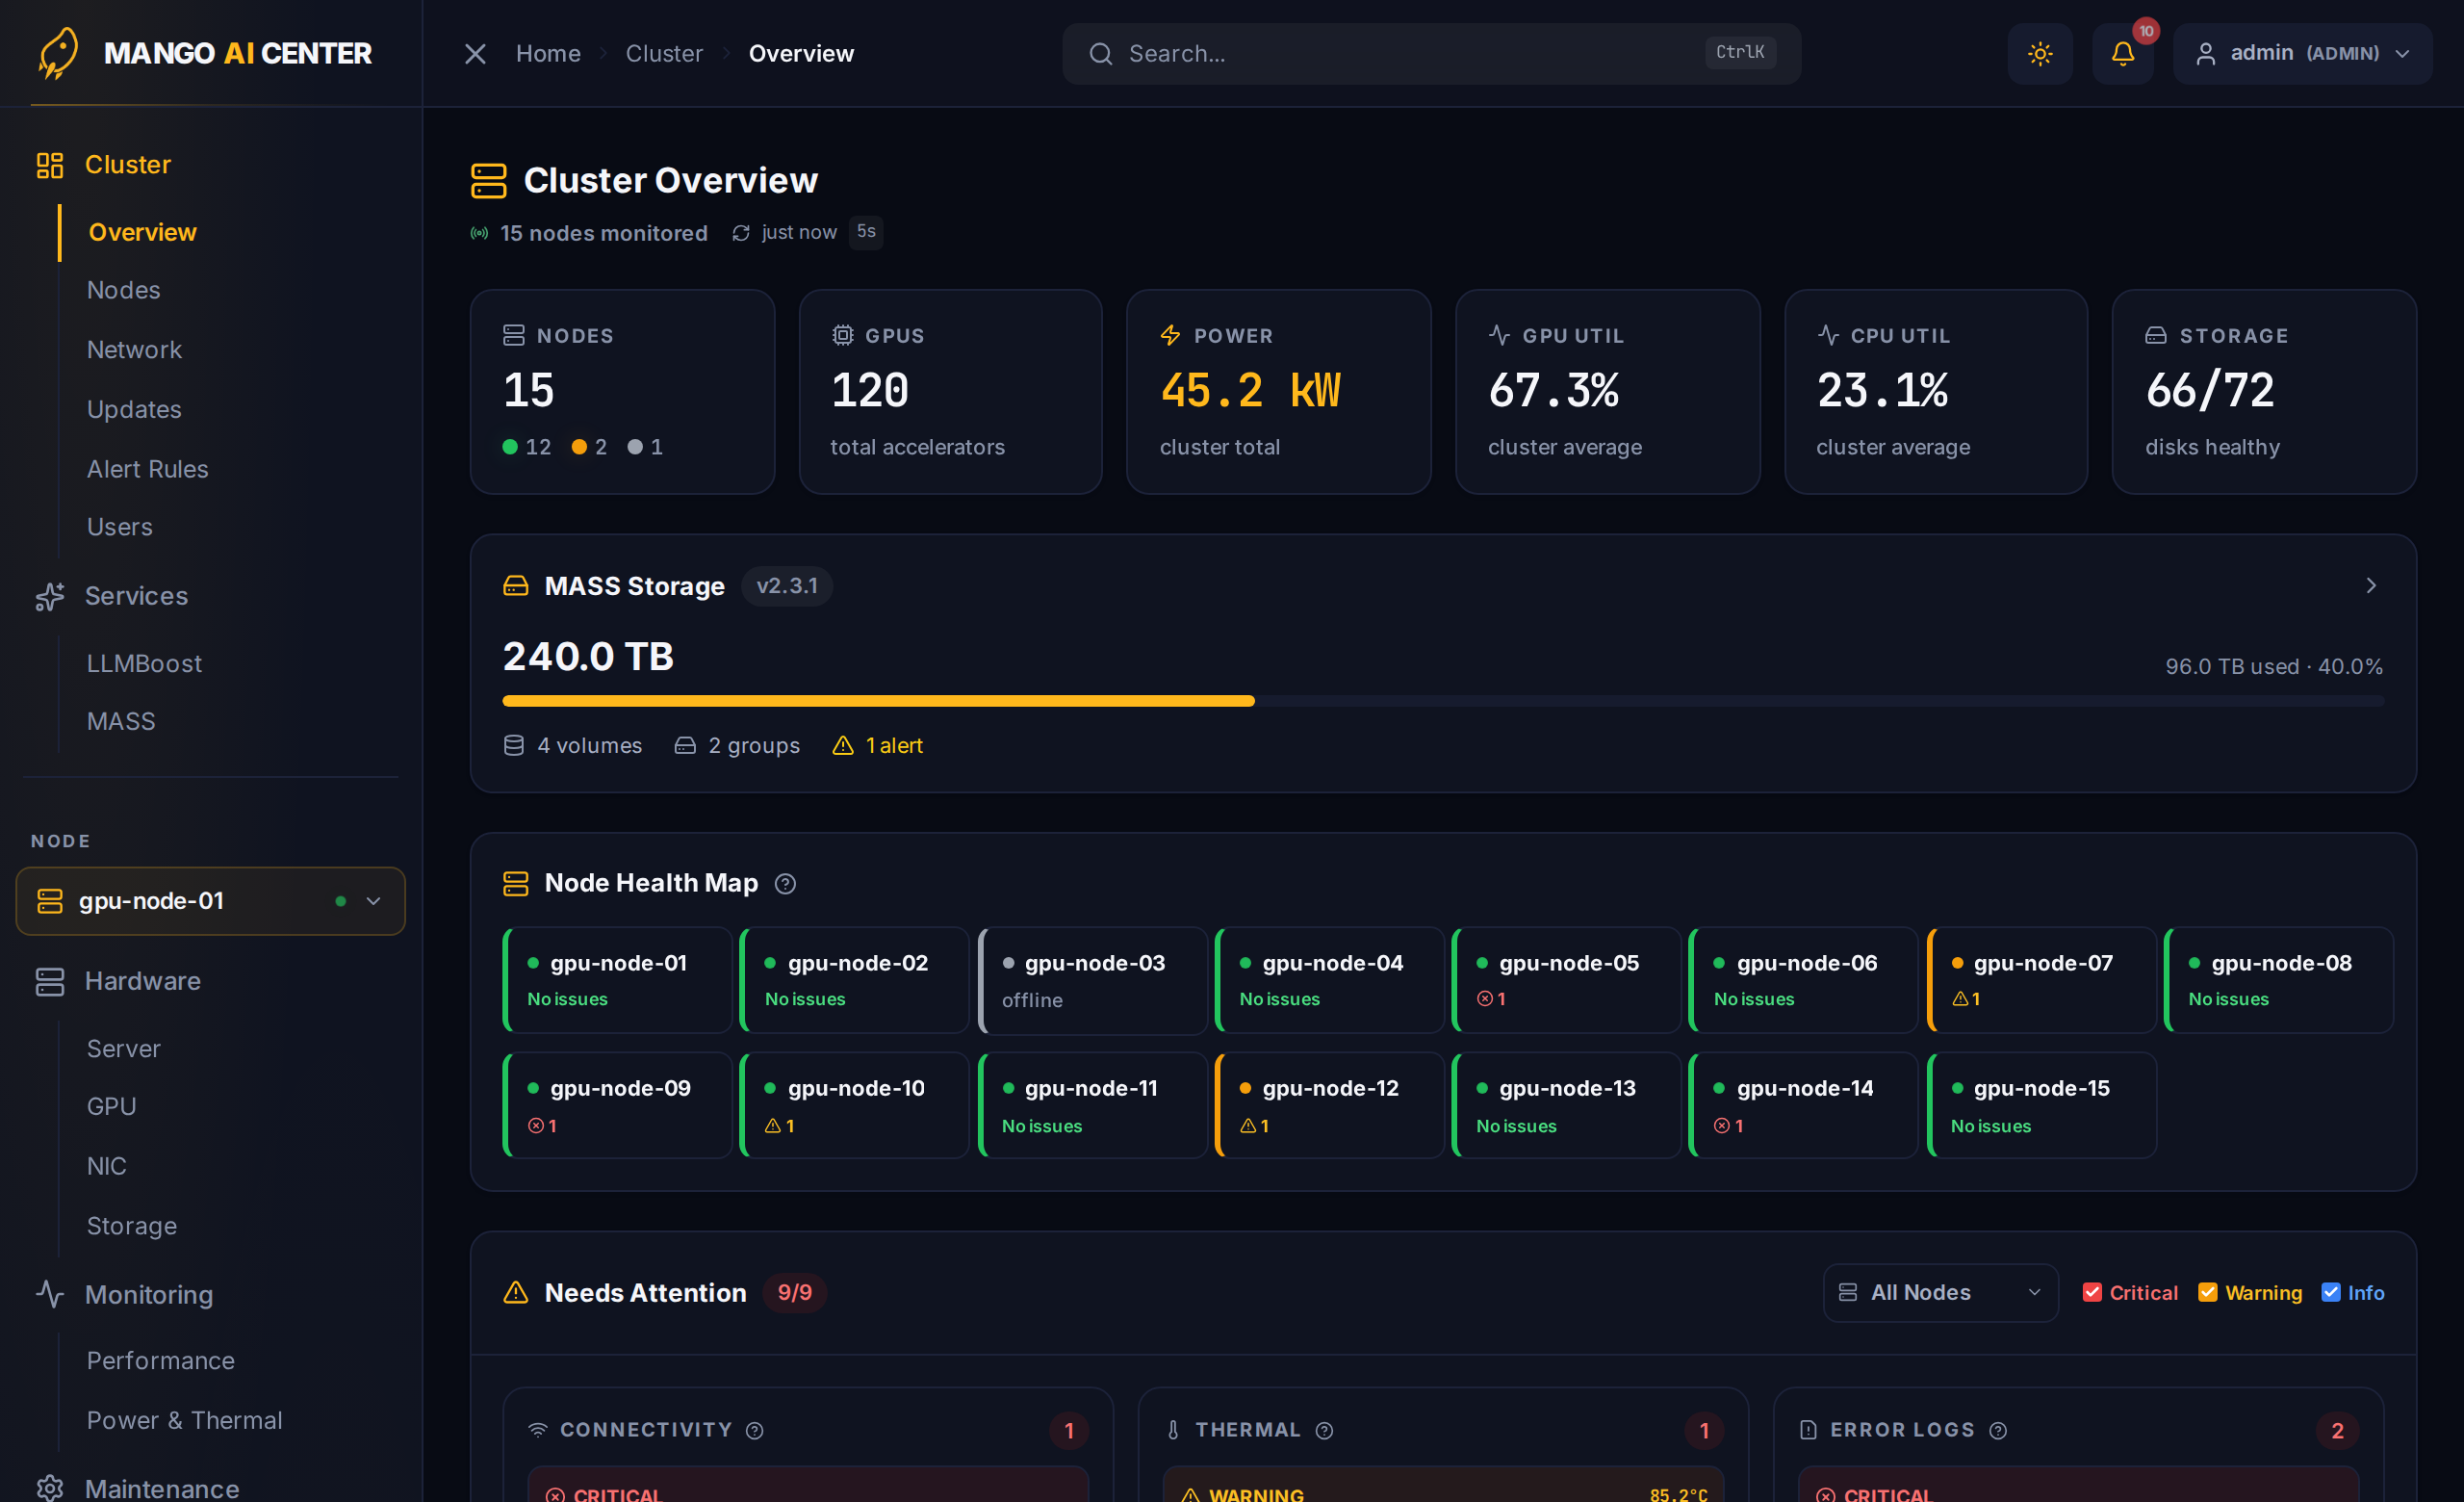
MAC is built around a lightweight Master / Agent architecture: one master node hosts the web dashboard, REST API, and Prometheus time-series database, while a small agent runs on each managed server to collect GPU / DPU / NIC metrics, system logs, and SDK state. Agents auto-register with the master on startup, so adding a server to your fleet is a one-line operation.
Highlights
Single Pane of Glass for AI Infrastructure
- Cluster-wide overview — per-node health, GPU/DPU/NIC inventory, alerts, power draw
- Real-time metrics for NVIDIA and AMD GPUs, MangoBoost DPUs, and RDMA-capable NICs
- Centralized log search across every agent (journal, dmesg, syslog)
Multi-Vendor Hardware Support
- GPUs — any NVIDIA GPU that DCGM monitors and any AMD GPU that ROCm monitors
- DPUs / RNICs — MangoBoost GPUBoost, NVIDIA BlueField / Mellanox ConnectX, Broadcom Thor2
- Switches — SONiC and Dell OS10
- BMC — IPMI / Redfish for out-of-band power and console access
Network Topology and Switch Management
- Interactive topology canvas with multi-tier Clos layout, auto-discovered from LLDP
- Per-port traffic counters, queue drops, PFC events, buffer watermarks
- One-click interface up / down, IP assignment, MTU change, breakout-mode change
- BGP neighbor and route configuration; ECMP max-paths management
- Browser-based SSH terminal for direct CLI access
- Rear-view physical port layout with click-through navigation to per-port details
- PCIe physical slot inventory derived from agent dmidecode + lspci data (no BMC required)
SDK and Firmware Lifecycle
- Inspect installed MangoBoost SDK packages on every agent
- Trigger install / upgrade / removal; track job status from the UI
- Coordinate parallel DPU firmware updates across multiple servers
LLM Inference Visibility (LLMBoost)
- Auto-discovers running LLMBoost Kubernetes clusters
- Shows served models, pod placement, request throughput, and latency
- Lifecycle controls — scale, pause, resume, and add/remove deployment keys
- Per-model metric breakdown (request counts, latency, tokens, KV cache)
- Direct link into the LLMBoost management UI
Architecture
- Master Node runs the web dashboard, REST API, Prometheus, and the metrics-bridge that unifies GPU exporters from every agent into a single Prometheus target.
- Agent Nodes run a small set of exporters (dcgm / rocm / nic / sw / sys), the mango-sdk-agent for SDK package management, and bmc-agent for BMC interaction. Agents push their logs to the master over Loki and expose metrics for Prometheus to scrape.
Dashboard at a Glance
The web UI is divided into five top-level sidebar sections:
| Section | Scope | Pages |
|---|---|---|
| Cluster | cluster-wide | Overview · Nodes · Network · Alert Rules · Users |
| Services | cluster-wide | LLMBoost |
| Hardware | per-node | Server · GPU · NIC · Storage |
| Monitoring | per-node | Performance · Power & Thermal |
| Maintenance | per-node | BMC · Software · Containers · Logs · Audit Log |
A node picker between Services and Hardware pins the dashboard to a specific server. Hardware, Monitoring, and Maintenance pages all render against the picked node.
Supported Hardware
GPUs
Any NVIDIA GPU exposed by DCGM (Datacenter GPU Manager) and any AMD GPU exposed by ROCm is monitored automatically. Validated in the field on NVIDIA A100 / H100 / RTX PRO 6000 Blackwell and AMD MI250 / MI300X / MI325X / Radeon AI Pro R9700.
DPUs / RNICs
| Vendor | Product | Notes |
|---|---|---|
| MangoBoost | GPUBoost RNIC (200/400 GbE) | RDMA, RoCEv2, FPGA-based |
| NVIDIA Mellanox | ConnectX, BlueField | RDMA NICs (via ethtool -S) |
| Broadcom | Thor2 (BCM57608) | RDMA via IB hardware counters |
Network Switches
- SONiC
- Dell OS10
BMC
- IPMI 2.0 / Redfish
Where to Go Next
- Getting Started — install the package, deploy master and agents, set the default password, and verify the cluster.
- User Guide — walk through every page on the dashboard with screenshots from a running cluster.
- CLI Reference — the
maccommand-line tool used to start, stop, and configure MAC services. - Troubleshooting — common issues and how to recover.