LLMBoost
The Services → LLMBoost page is a read-only serving dashboard for a
LLMBoost model-serving cluster. MAC talks to the
cluster's own OpenAI-compatible API and scrapes the serving engine's Prometheus
/metrics; it works with SGLang-, vLLM-, and legacy llmboost:-prefixed engines. The
link is always present in the sidebar; the page shows a connection card when no cluster
is reachable.
Connecting
MAC finds the serving API in one of three ways, in priority order:
- Runtime override — an admin pastes the API endpoint into the connection card at the top of the page (stored in memory; a master restart reverts it).
- Environment variable —
LLMBOOST_API_ENDPOINTset on the master. - Auto-discovery — the api-server probes every registered agent's IP on port 30080,
looking for a LLMBoost cluster that exposes the management API (
:30080/api, with the management UI reachable at:30080/manage/).
Auto-discovery only finds clusters laid out with that management surface. A standalone
engine that serves the OpenAI API at the root (:30080/v1/models, no /manage/) is
not auto-discovered — point MAC at it with the runtime override or LLMBOOST_API_ENDPOINT.
Also use the override or env var when the serving cluster is on a subnet no agent can
reach. Clearing the override re-enables auto-discovery.
What's on the Page
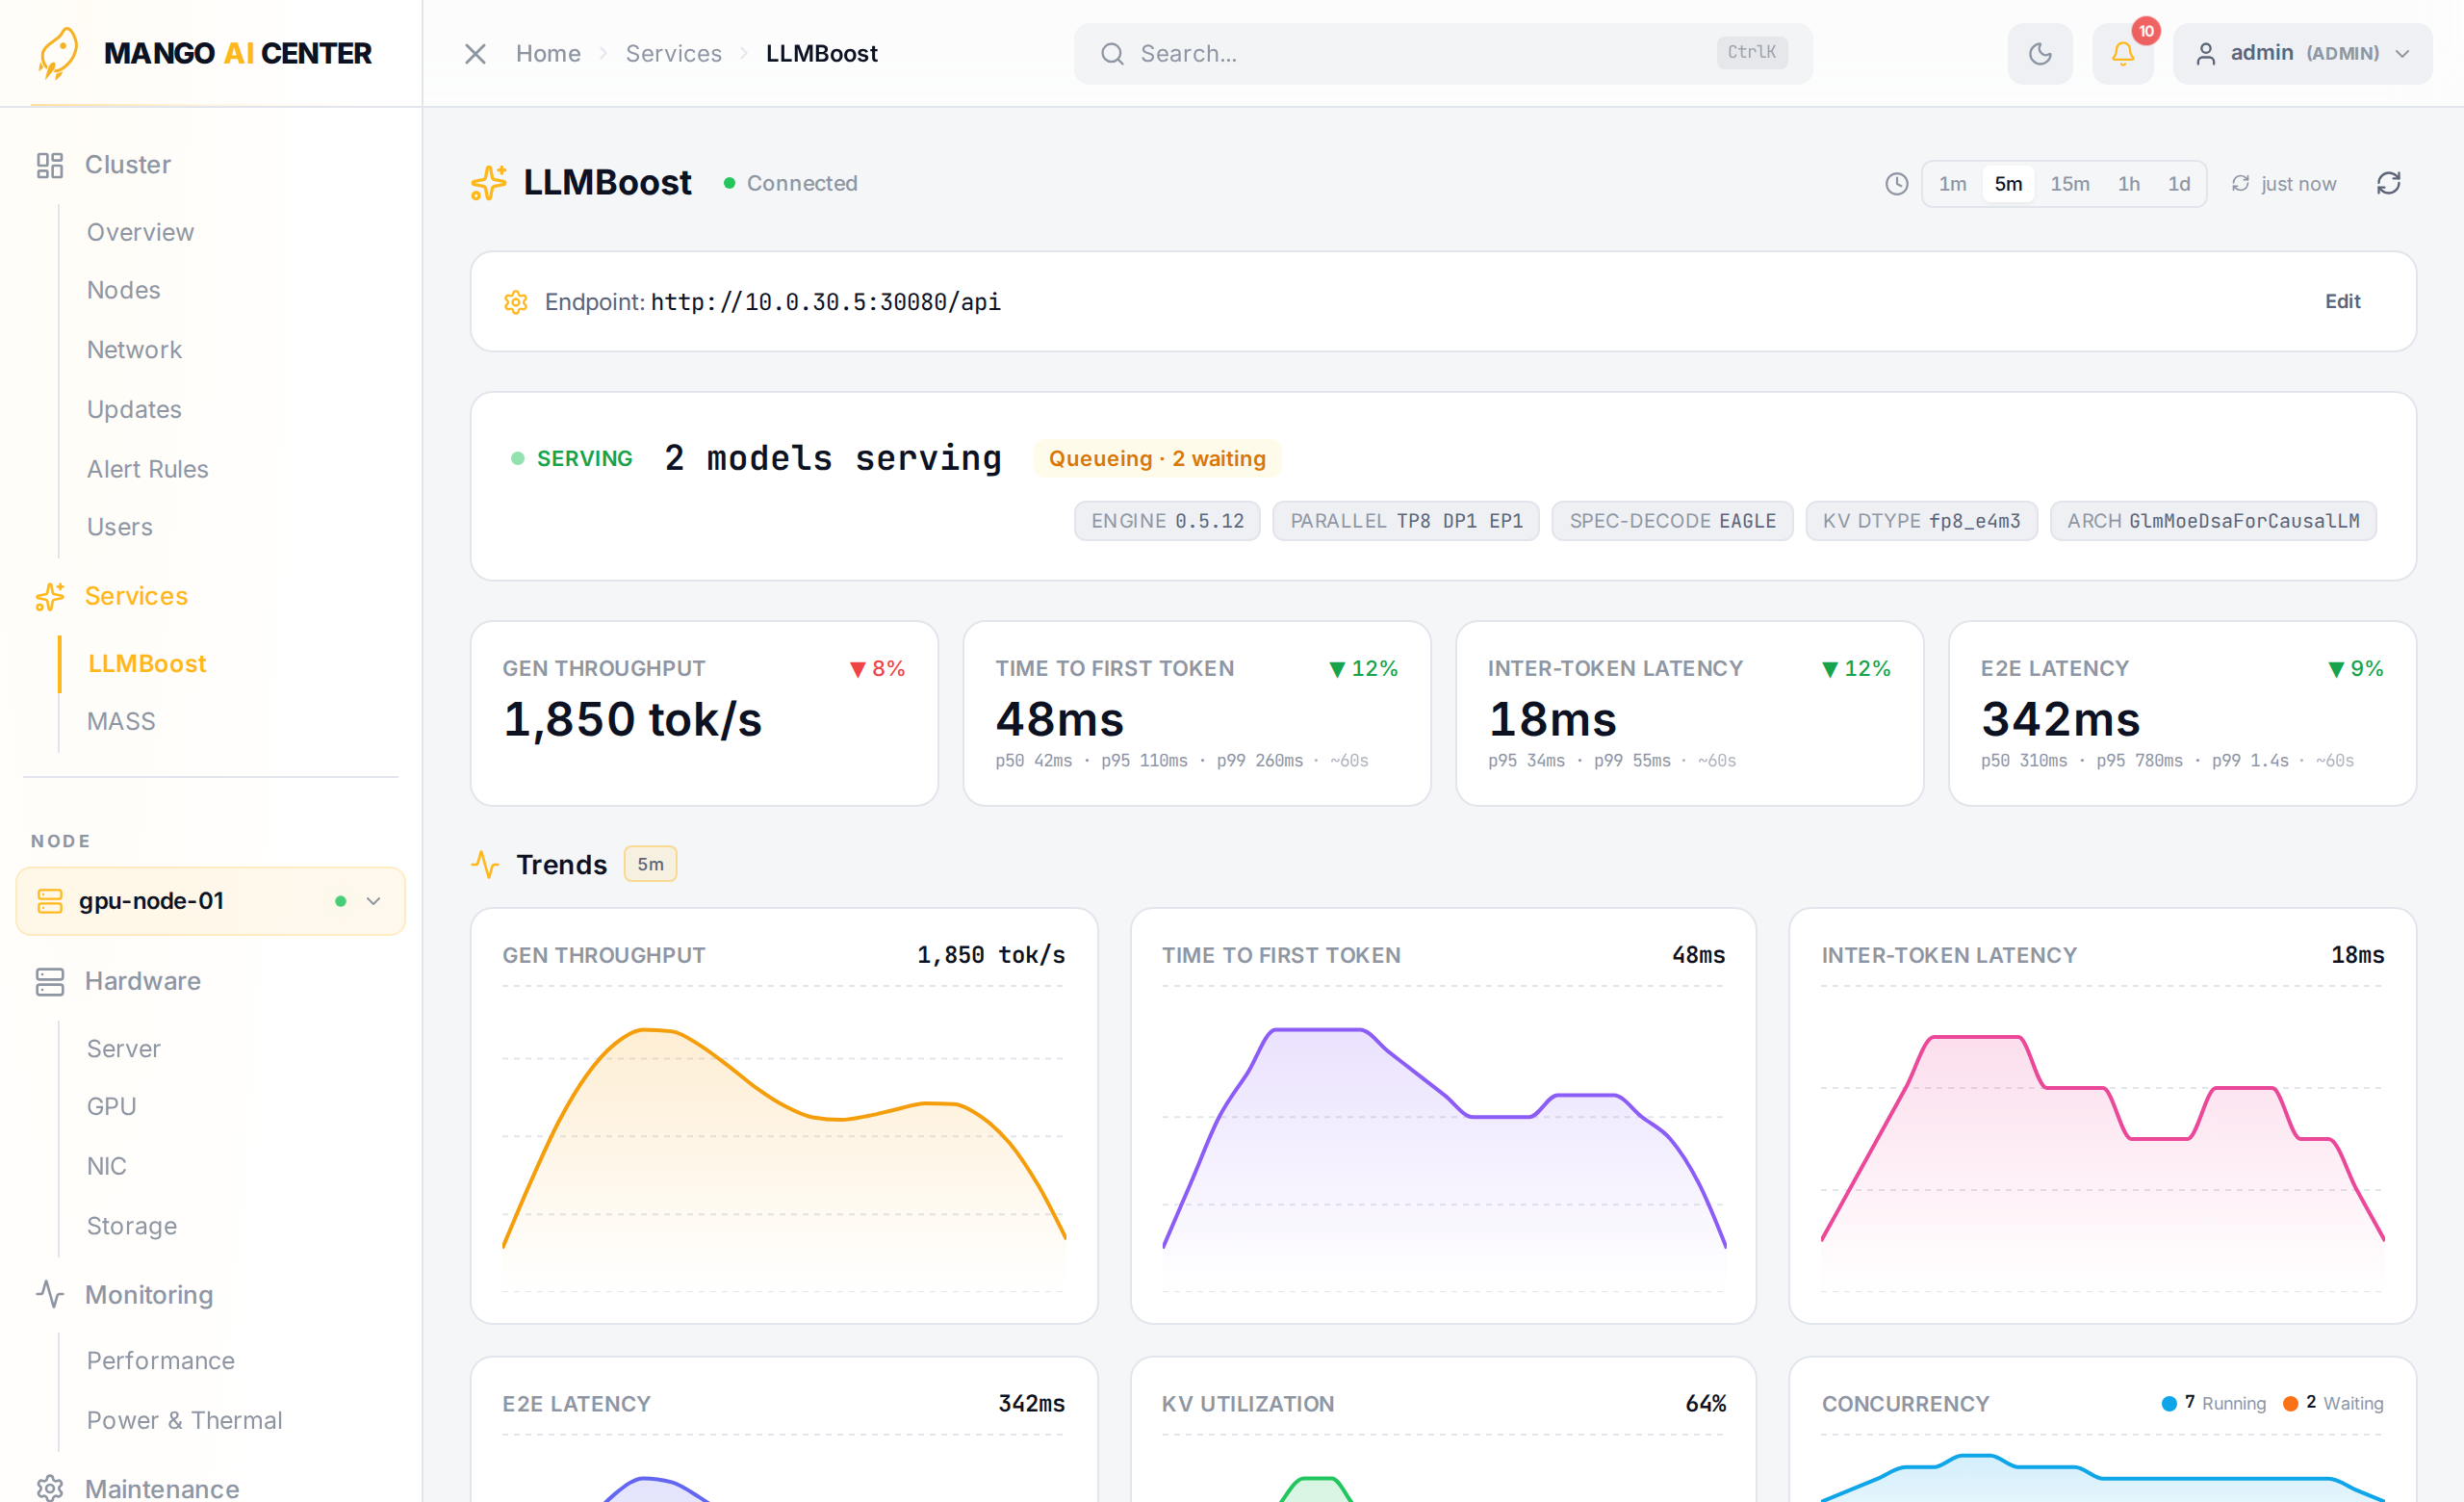
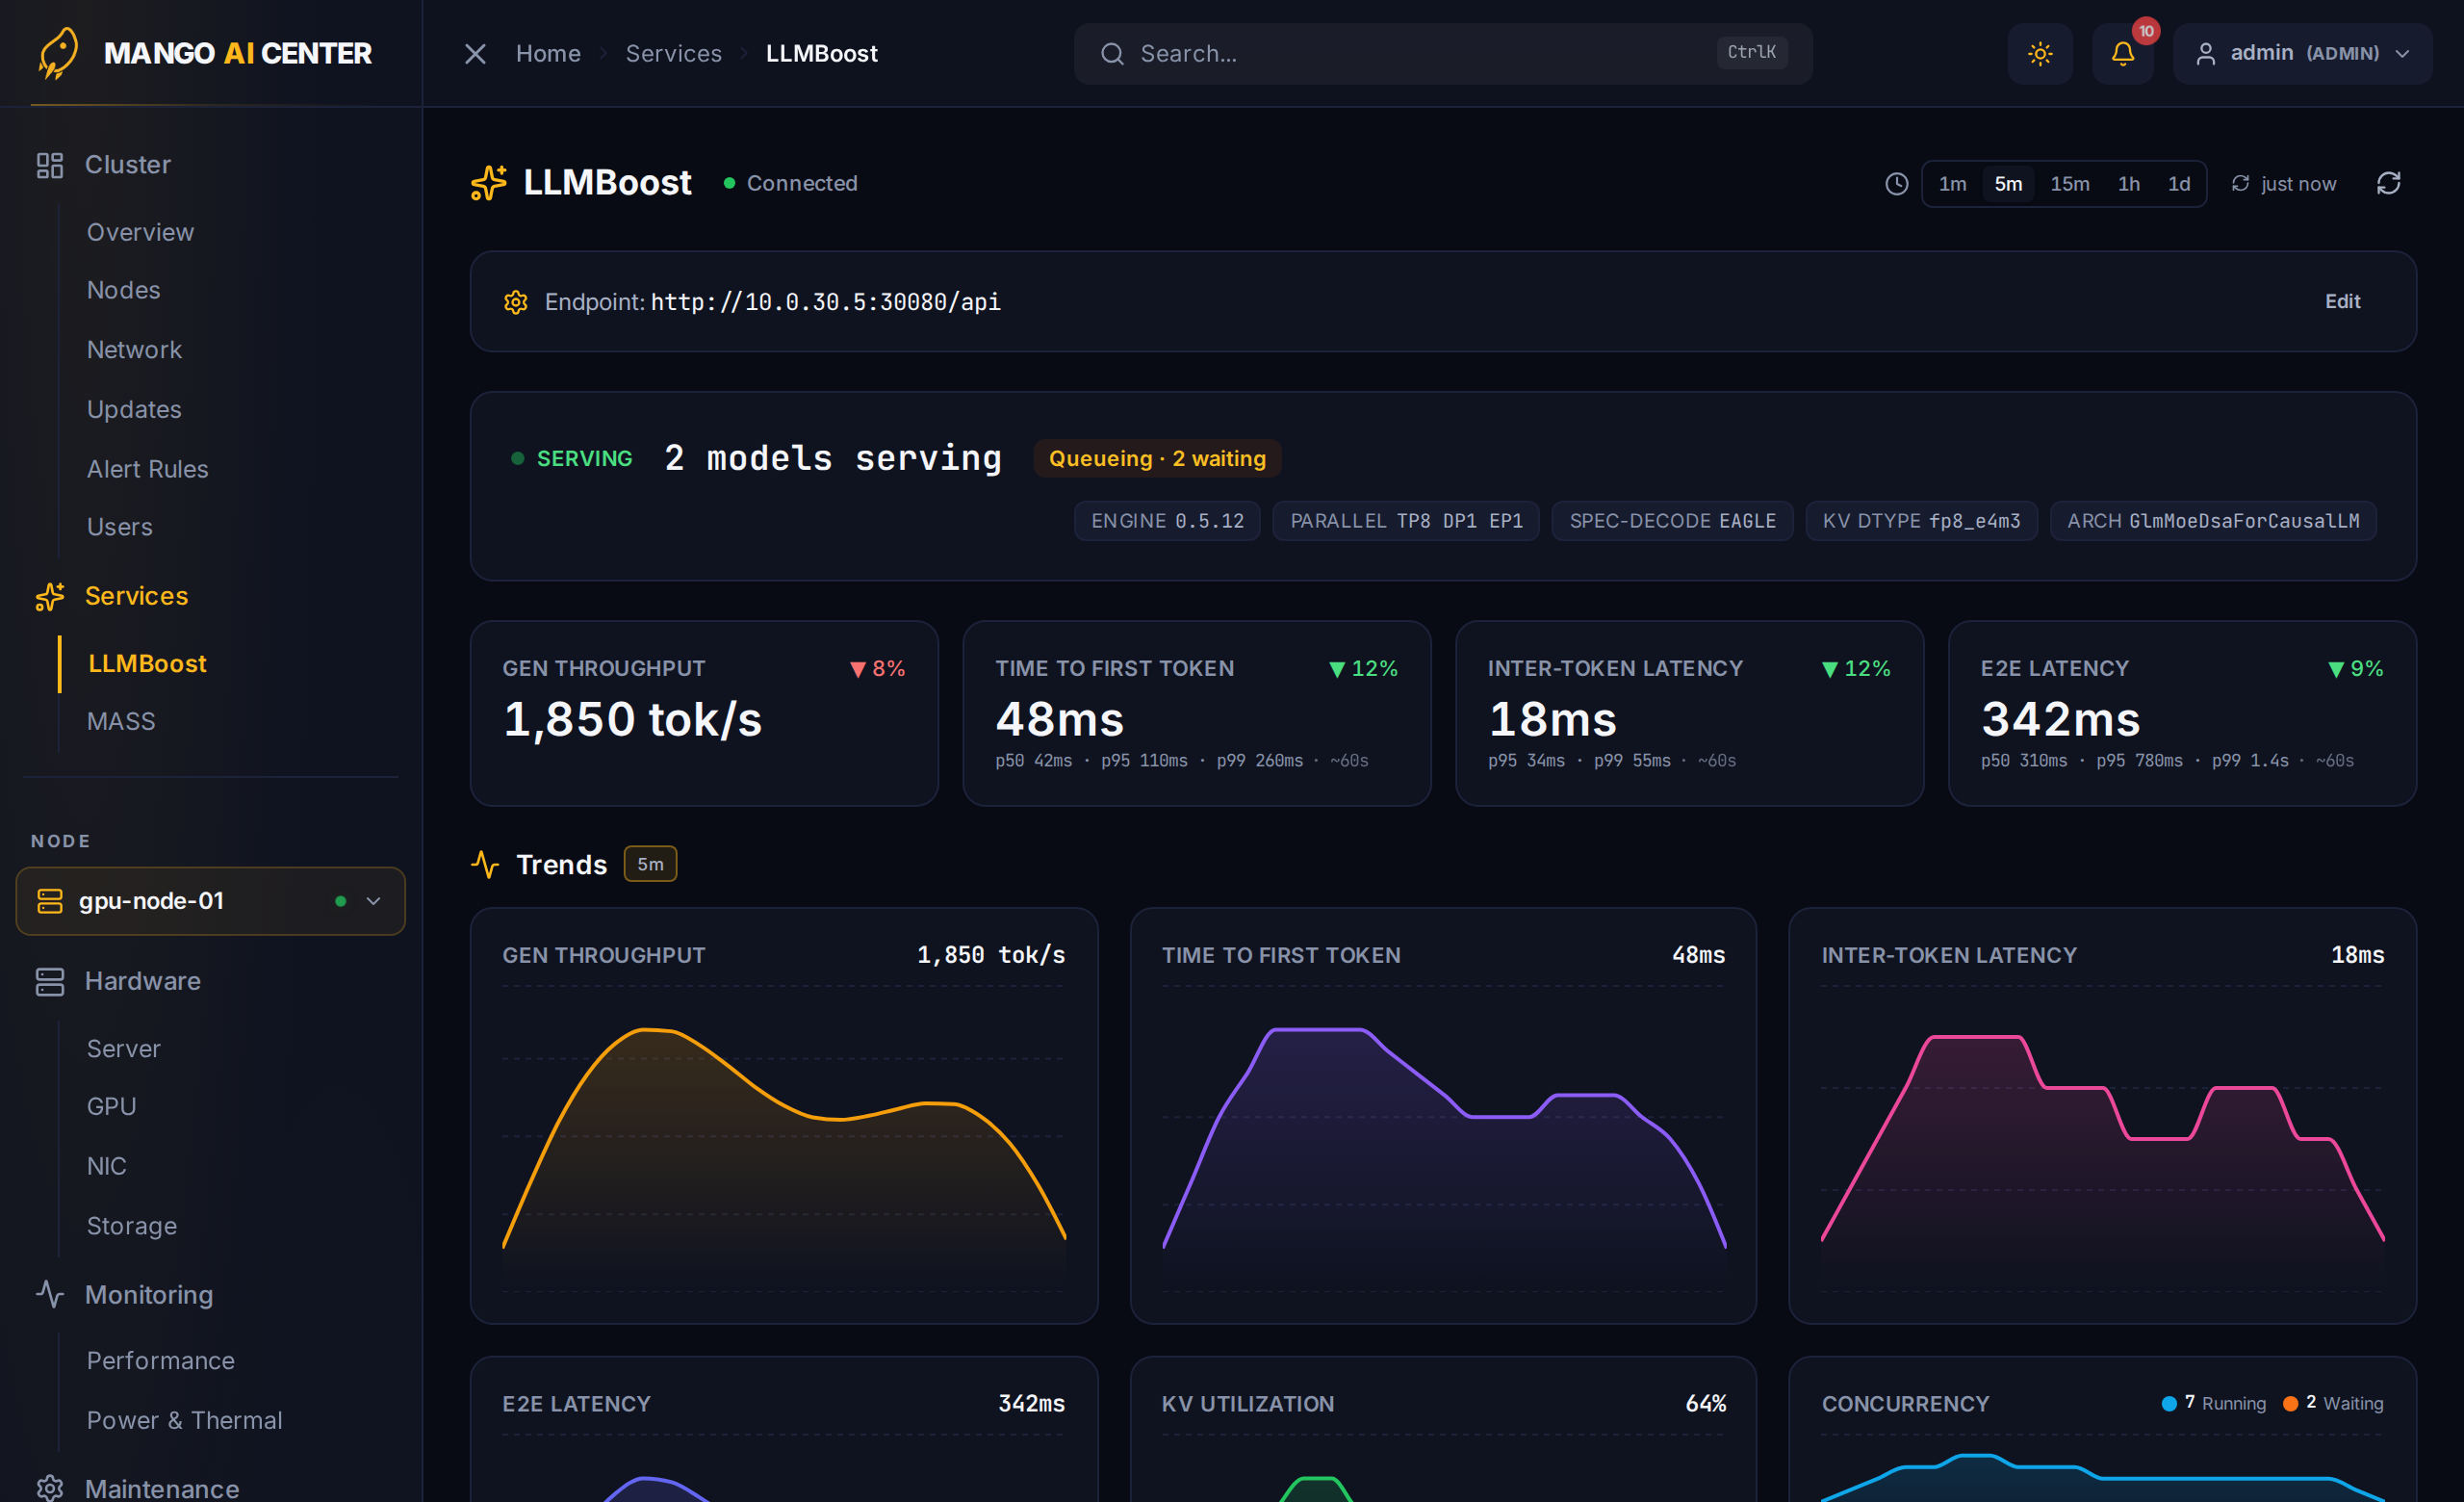
The dashboard reads top-to-bottom like a vLLM/SGLang serving view — each fact appears exactly once.
Serving Hero
A single banner answering "is it alive right now": a state beacon (Serving /
Idle / Awaiting traffic / Unreachable), the served model id as the headline (or
N models serving), pressure badges shown only when actionable (queueing, KV cache
≥ 90 %, running slots full), and engine-identity chips that fold in the former Engine
Info section — context length, engine version, parallelism (TP/DP/EP), speculative-decode
algorithm, KV-cache dtype, model architecture, and extra modalities. Engines without
introspection (e.g. vLLM) simply show fewer chips. When the cluster goes unreachable the
hero carries a stale-data note, since the api-server keeps serving its last-known snapshot.
KPI Tiles
The four headline serving metrics as scannable current values — Gen throughput, Time to First Token, Inter-Token Latency, and E2E Latency — each with a short-window trend delta and a p50 / p95 / p99 tail-percentile subline. The percentiles are computed over a recent-traffic window (typically the last ~60 s; the tile tooltip states the actual basis, falling back to lifetime when the engine is idle). No sparkline here — the rolling curve for each lives in the Trends grid below.
Trends
A grid of equal-height rolling charts at one readable size: Gen throughput, Time to
First Token, Inter-Token Latency, E2E Latency, KV Utilization, and a
Concurrency card (running vs. the engine's max_running_requests ceiling, with the
running-slot saturation bar, scheduler queue time, and the retracted/aborted reliability
counters folded in). A compact time-window selector in the header — 1m / 5m / 15m /
1d (default 15m) — scopes every chart at once. All windows are served from the persisted
mac_llmboost_* Prometheus series (see Persistence), so the charts show
real history immediately after a page refresh instead of re-accumulating from scratch;
the header values stay the latest live reading.
Workload
Request-shape distributions — prompt size, output size, and prefix-recompute share — that make the latencies above interpretable. Rendered only once the engine has served traffic and exports the token histograms; it self-hides when they are absent.
KV Cache & Memory
The tiered KV-cache hierarchy: L1 GPU pool as a live stacked active / reclaimable /
free bar, L2 host-RAM with live occupancy when the engine exports it (else
capacity-only), and L3 disk = the configured storage backend or "not configured",
plus a prefix-cache-hit stat. The host and disk tiers appear when the engine runs with
hierarchical caching (--enable-hierarchical-cache). On desktop this panel sits two-up
beside the lifetime Totals strip.
Totals
The quiet lifetime / rate row: completed requests, derived requests/min, token totals, average generated tokens per request, cache-hit rate, and — with speculative decoding — the acceptance rate. Cells the engine doesn't expose are omitted rather than shown as blanks.
Models
A single merged table (catalog metadata + live per-model load, including inter-token
latency), keyed off the model_name Prometheus label. It is rendered only when more
than one model is served — a single-model deployment is already fully represented by the
hero and the KPI tiles, so repeating it as a one-row table would be pure duplication.
Persistence
The api-server re-publishes the parsed and derived serving metrics (windowed
percentiles, prefix-cache-hit ratio, per-tier KV token splits — values the raw engine
series don't expose as single gauges) as mac_llmboost_* gauges on its own Prometheus
/metrics (an aggregate set plus a per-model set labelled model, plus mac_llmboost_up).
MAC's Prometheus already scrapes the api-server, so this history lands in its TSDB and is
retained across restarts with no new database — which is what lets the Trends charts (and
especially the 1d window) show real history rather than re-accumulating each visit.
During idle or unreachable periods the serving-rate gauges are published as NaN, so the
charts show gaps instead of a flat held-over line.
What's Not on the Page
The model-serving API deliberately exposes no system/node information and no management surface, so MAC does not show K8s nodes, deployments, or pod placement, and offers no scale/pause/resume controls. There is also no per-request call history — the serving API doesn't provide one. Hardware-level GPU monitoring for the serving nodes is available on the regular per-node pages when those nodes are registered MAC agents.
Troubleshooting
See the LLMBoost troubleshooting page when the page stays disconnected even though a cluster is up.