Cluster Overview
The landing page after login. It answers the question "is anything wrong with my fleet?" in one screen.
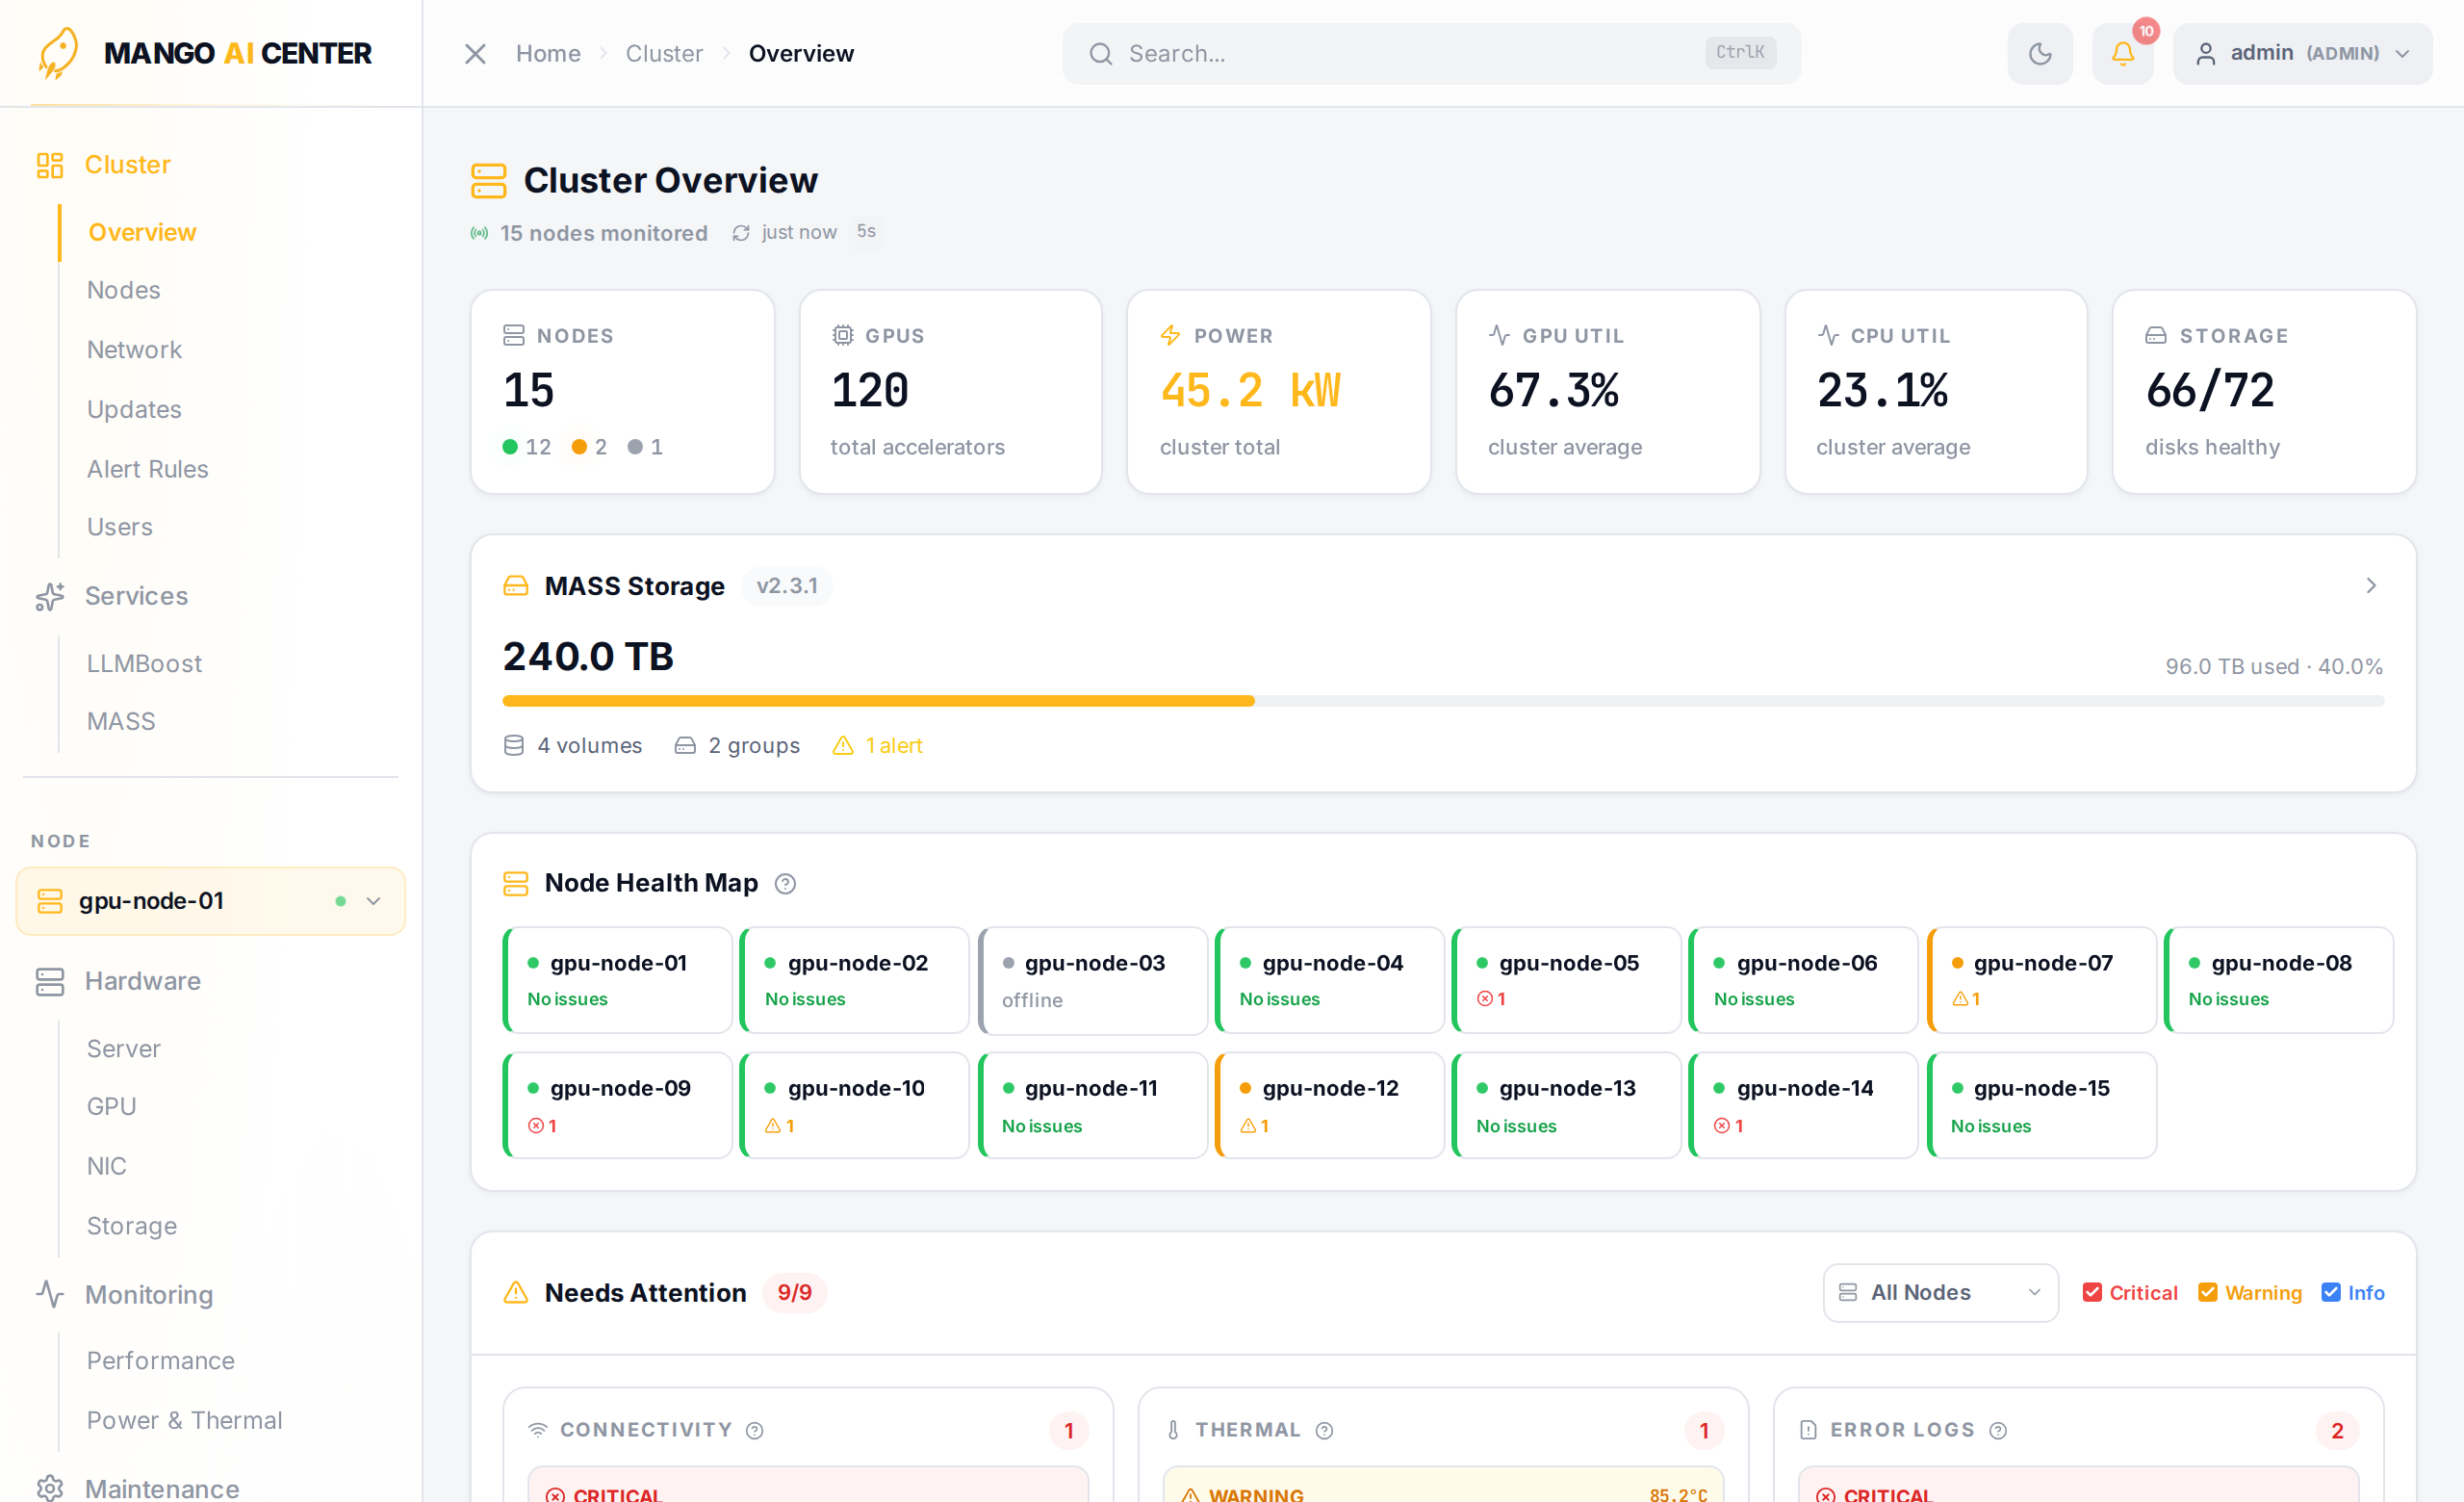
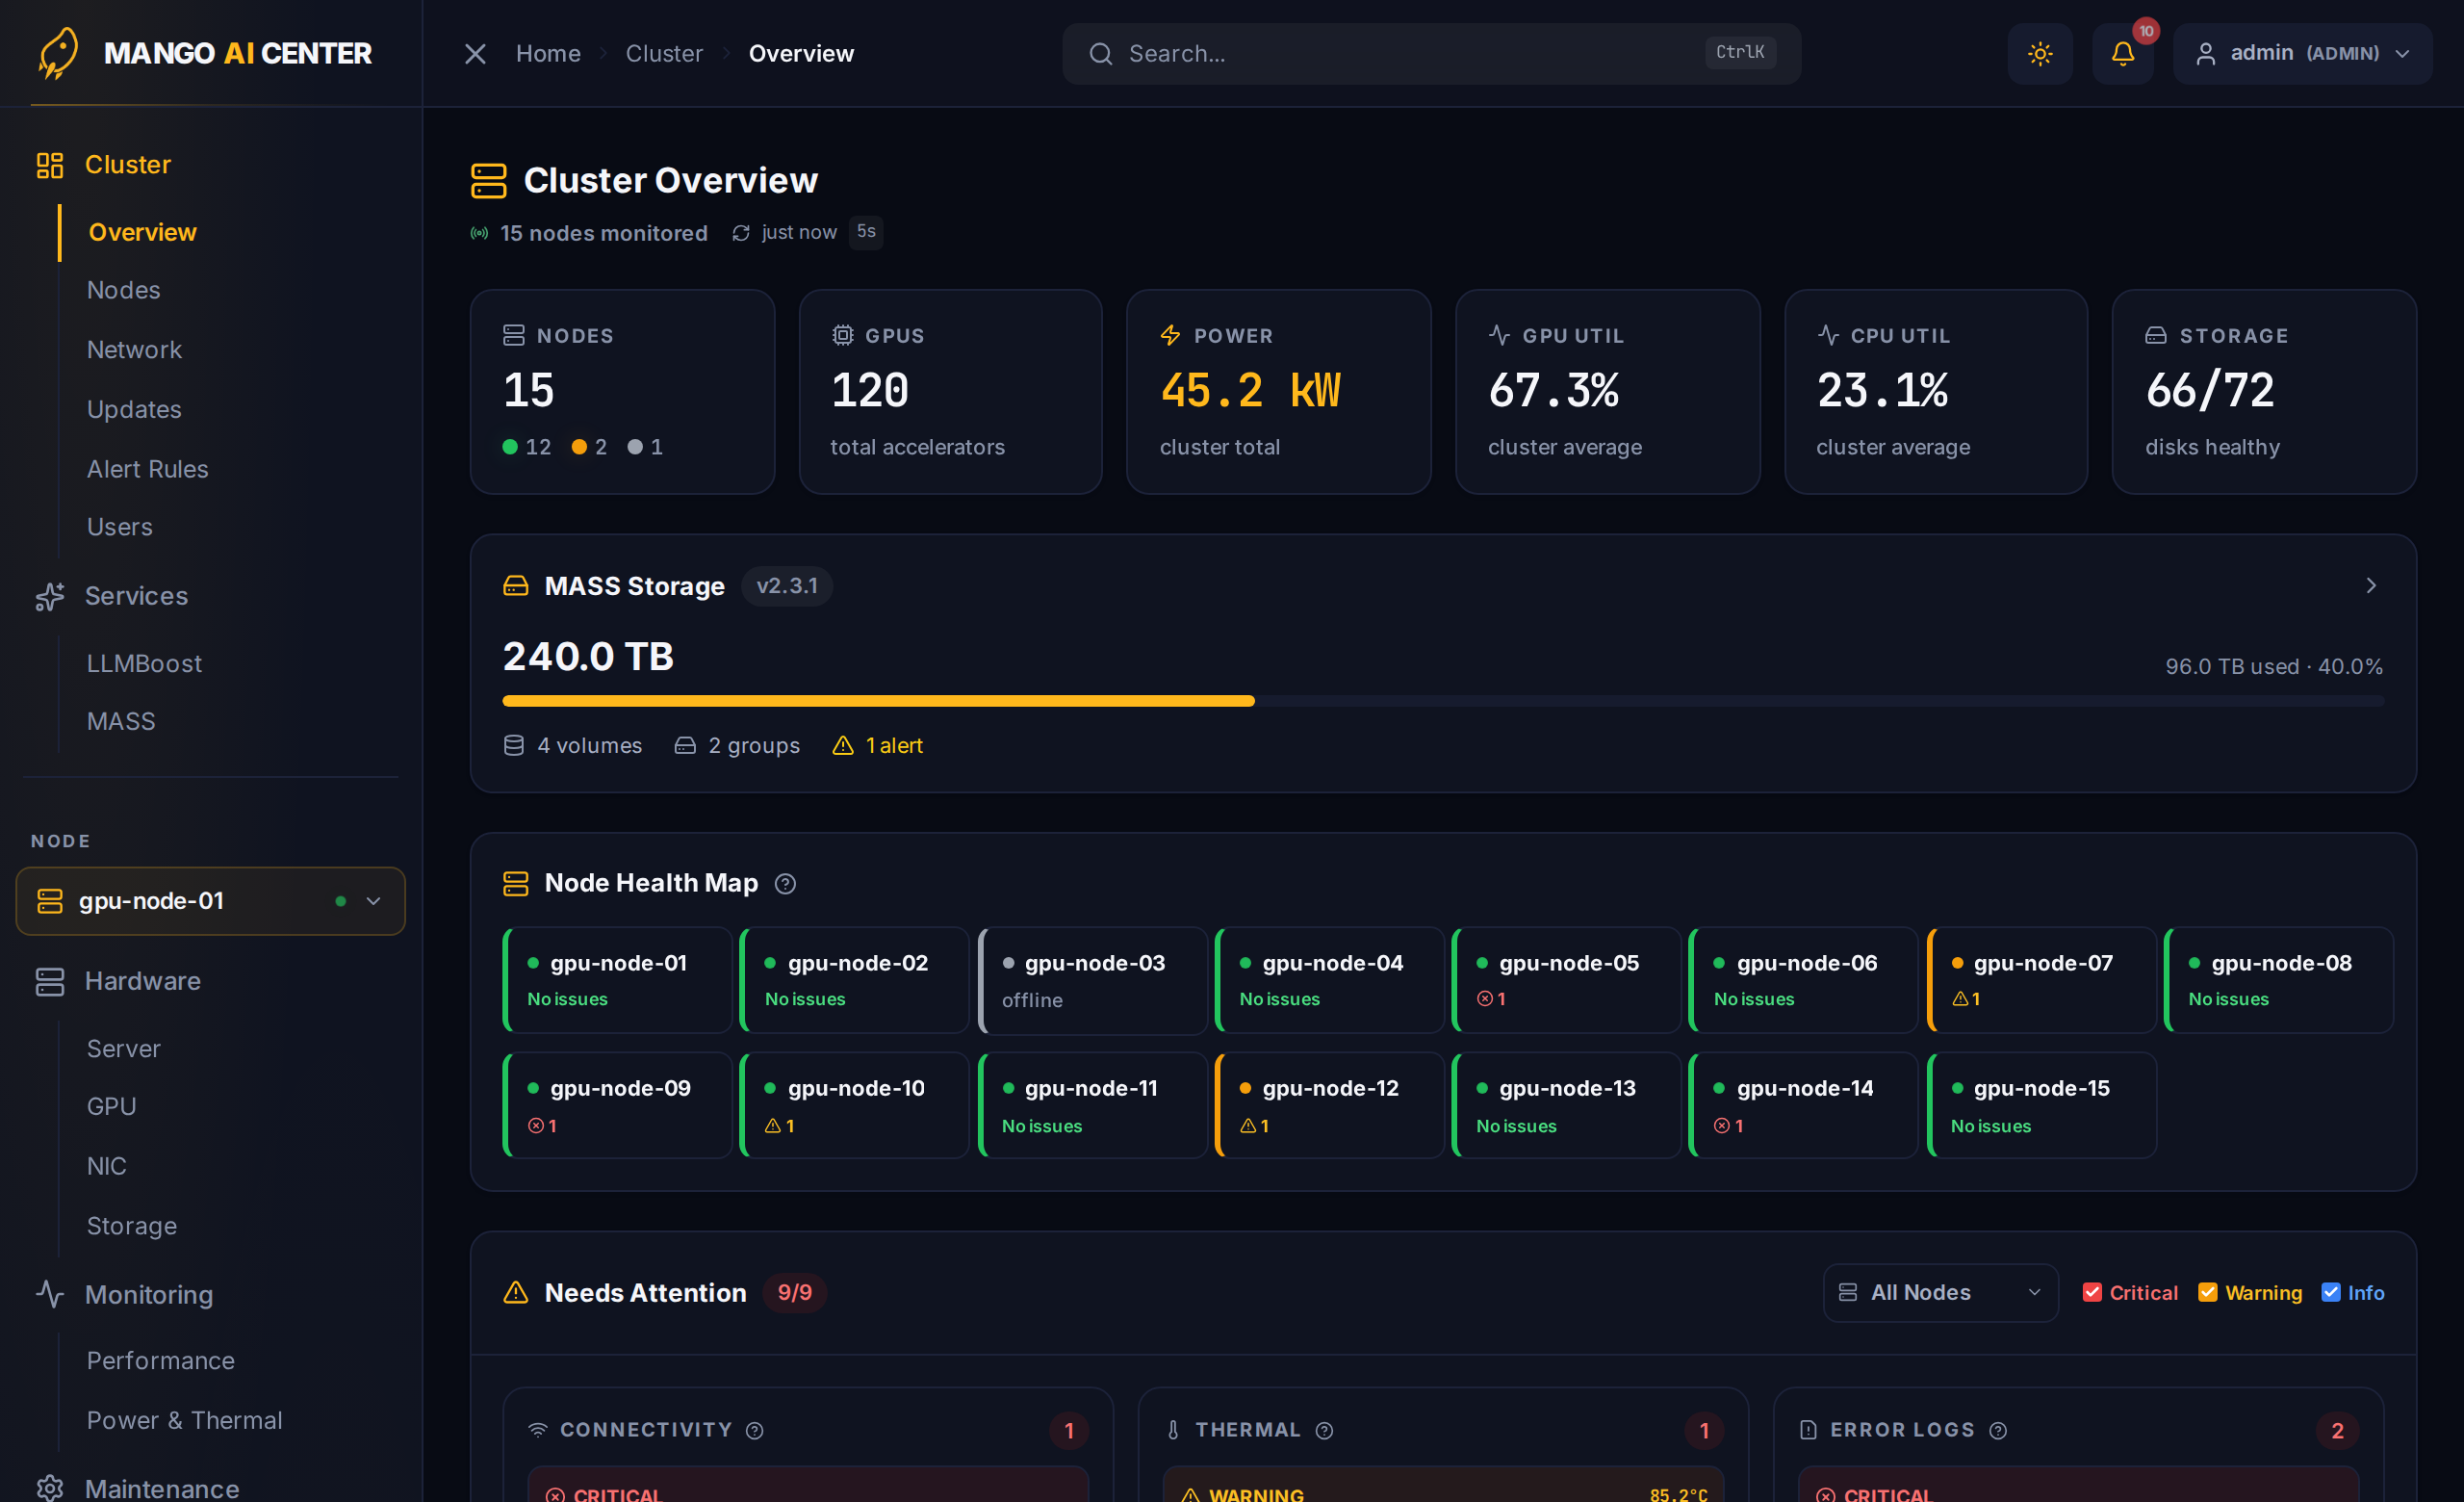
Header KPIs
The strip at the top aggregates the entire fleet:
| Tile | Meaning |
|---|---|
| Nodes | Total registered agents, with online / offline counts below |
| GPUs | Total accelerators across the fleet |
| Power | Aggregate cluster power draw (kW) |
| GPU Util | Cluster-average GPU utilization |
| CPU Util | Cluster-average CPU utilization |
| Storage | Healthy / total disks across the fleet |
Node Health Map
One tile per registered agent, color-coded:
- Green — healthy, no issues
- Yellow — warning (e.g. version drift, container unhealthy)
- Red — critical (offline, hardware fault)
- Gray — agent has not reported recently
Click a tile to filter the rest of the page to that node. Click again to clear the filter.
Needs Attention
The Needs Attention section is a merged feed of issues across the fleet, grouped into one card per category:
- Connectivity — agents that can't reach the master, switches with stale SNMP data
- Thermal — GPUs / DPUs / inlet sensors over threshold
- Error Logs — recent kernel ERRs / fatal journal entries
- Containers — Docker containers stuck in
restartingor unhealthy - CPU / Memory / Storage — utilization spikes
- Version Drift — software versions that differ from the cluster majority
(the screenshot above shows a
gpu_driverandtoolkitmismatch) - Node Status — agents that have gone offline within a maintenance grace window
The filter chips on the right (Critical, Warning, Info) hide noise when triaging.
A per-node dropdown above the chips narrows the feed to a single host.
Cluster Power
Below Needs Attention, a time-series chart plots the fleet's aggregate power draw (W). The time-range chips above the chart (1 h / 6 h / 24 h / 7 d / 30 d) zoom out for capacity-planning views.
Polling Cadence
The page refreshes every 5 seconds while visible and pauses polling when you switch tabs to keep network usage low.
What's Next
- Pick a noisy node and dig into its hardware via Hardware → Server.
- Open Network Topology to confirm the fabric is intact.
- If a thermal alert is firing, jump to Power & Thermal.