LLMBoost
The Services → LLMBoost page surfaces a LLMBoost
Kubernetes cluster running on one of your registered agents. The link is always present in
the sidebar; the page shows Disconnected and an empty node list when no cluster is
reachable.
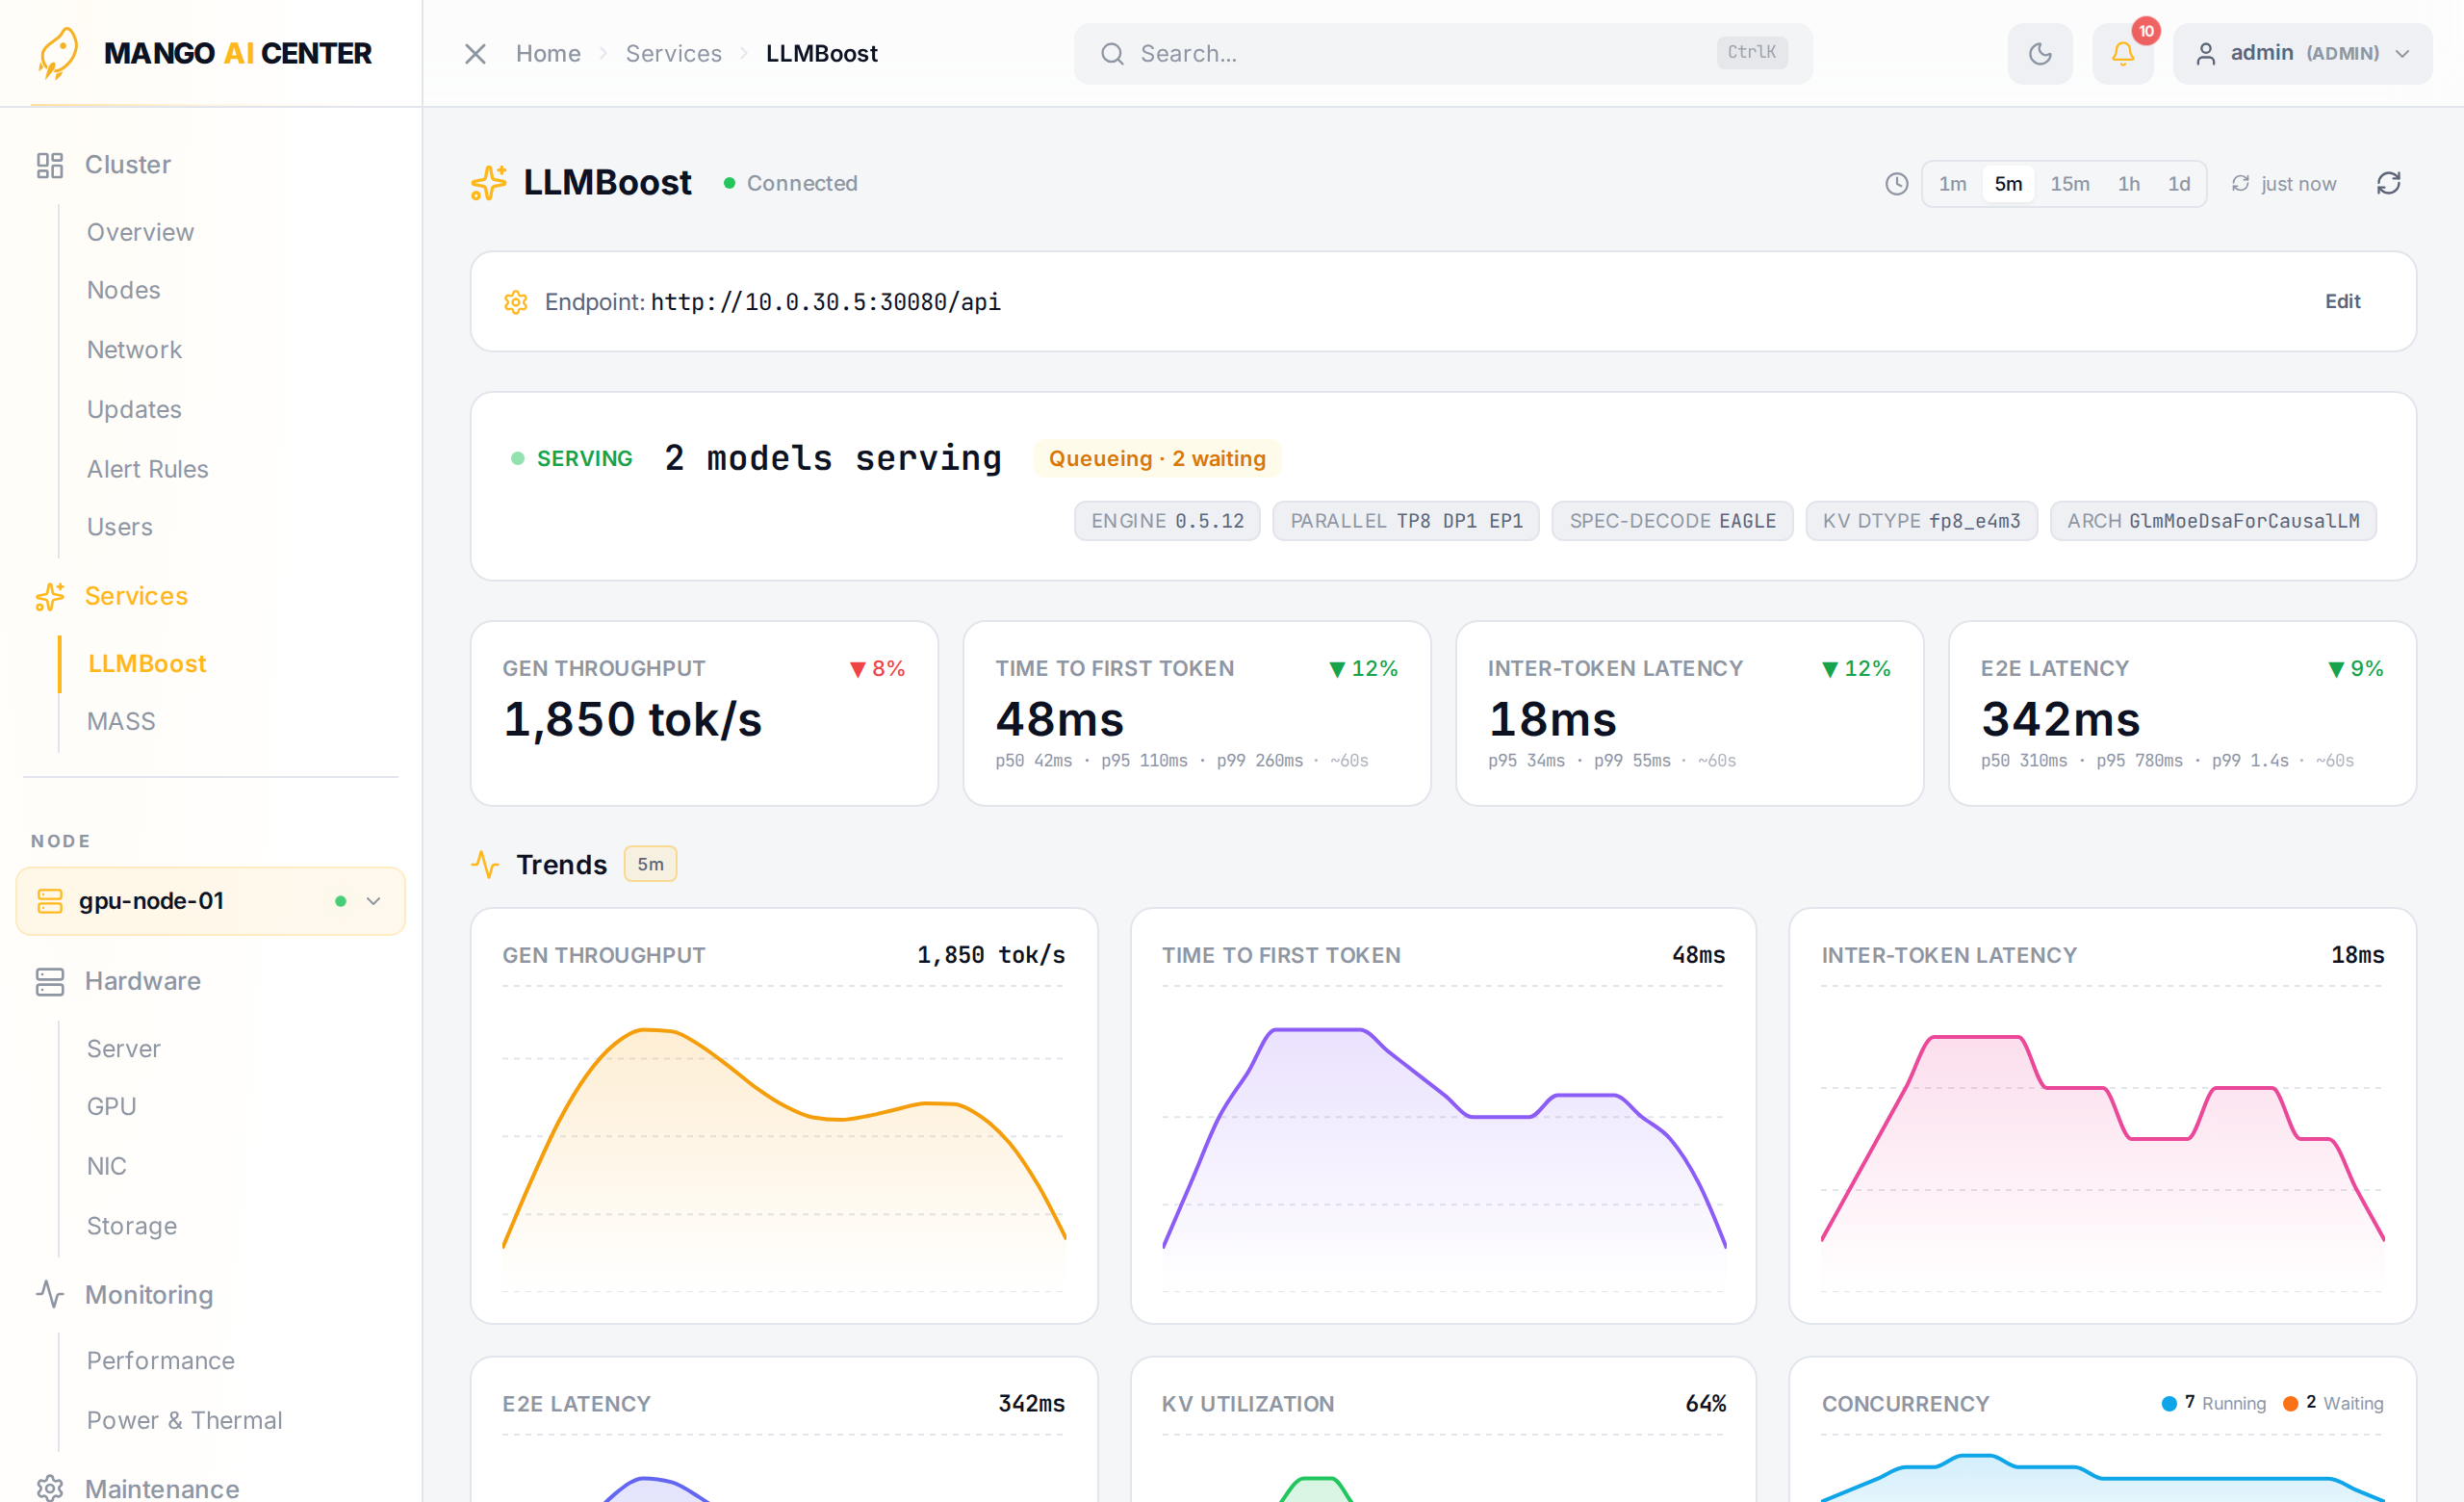
What's on the Page
Status
Connection health, the LLMBoost API endpoint, the K8s control-plane node, and the ratio of ready / total worker nodes.
Kubernetes Access Token
A token input sits near the top of the page: paste a read-only K8s service-account token and click Save to enable the full cluster view (deployments and pod placement). Without a token, MAC still shows models and live metrics scraped from the LLMBoost API.
Live Metrics
- Active Requests — currently in-flight inferences
- Completed Requests — finished requests since LLMBoost started
- Average Latency — rolling latency window over the last minute
- Token Throughput — generated tokens per second
The metrics block updates roughly once per second and feeds rolling charts beneath each KPI.
Cluster Nodes
One card per K8s node, with:
- GPU type and count
- Allocation bar — how much GPU is reserved by LLMBoost workloads
- Role tags — control-plane / worker / inference / monitoring / dashboard
- Status pill — ready / not-ready
Served Models
The list of models currently served by LLMBoost: model name, hosting node, GPU assignment,
and running status. Click a row to see the model's per-model metric breakdown — request
counts, latency, generated tokens, and KV-cache utilization, keyed off the model_name
Prometheus label.
Deployment Lifecycle Controls
Operators (and admins) can manage LLMBoostDeployment CRDs directly from the UI:
- Scale — adjust
numInstancesandnumActiveInstancesfor a deployment key - Pause / Resume — set
numActiveInstancesto 0 (pause) or restore it tonumInstances - Add Key — append a new model deployment entry to an existing CRD
- Remove Key — delete a deployment entry from a CRD via merge-patch
A live GPU correlation view shows the per-node, per-GPU DCGM metrics (utilization, memory usage, power) for the GPUs hosting each deployment's pods, so you can verify that scaling actions actually reach hardware.
Dashboard Link
A button at the top opens the LLMBoost management UI (Headlamp) at
http://<node>:30080/manage/ in a new tab — useful for queue / pod-level operations that
aren't surfaced in MAC.
Auto-Discovery
The api-server probes each registered agent's IP on port 30080 (LLMBoost NodePort) and
6443 (K8s API). If neither responds, the page shows Disconnected. See
Getting Started → First-Time Setup → LLMBoost Auto-Discovery
or the LLMBoost troubleshooting page when the page stays
disconnected even though a cluster is up.