GPU
Per-GPU live state for the picked node. The page is a flat grid of cards — one per GPU — showing every metric the dashboard's GPU drilldowns expose.
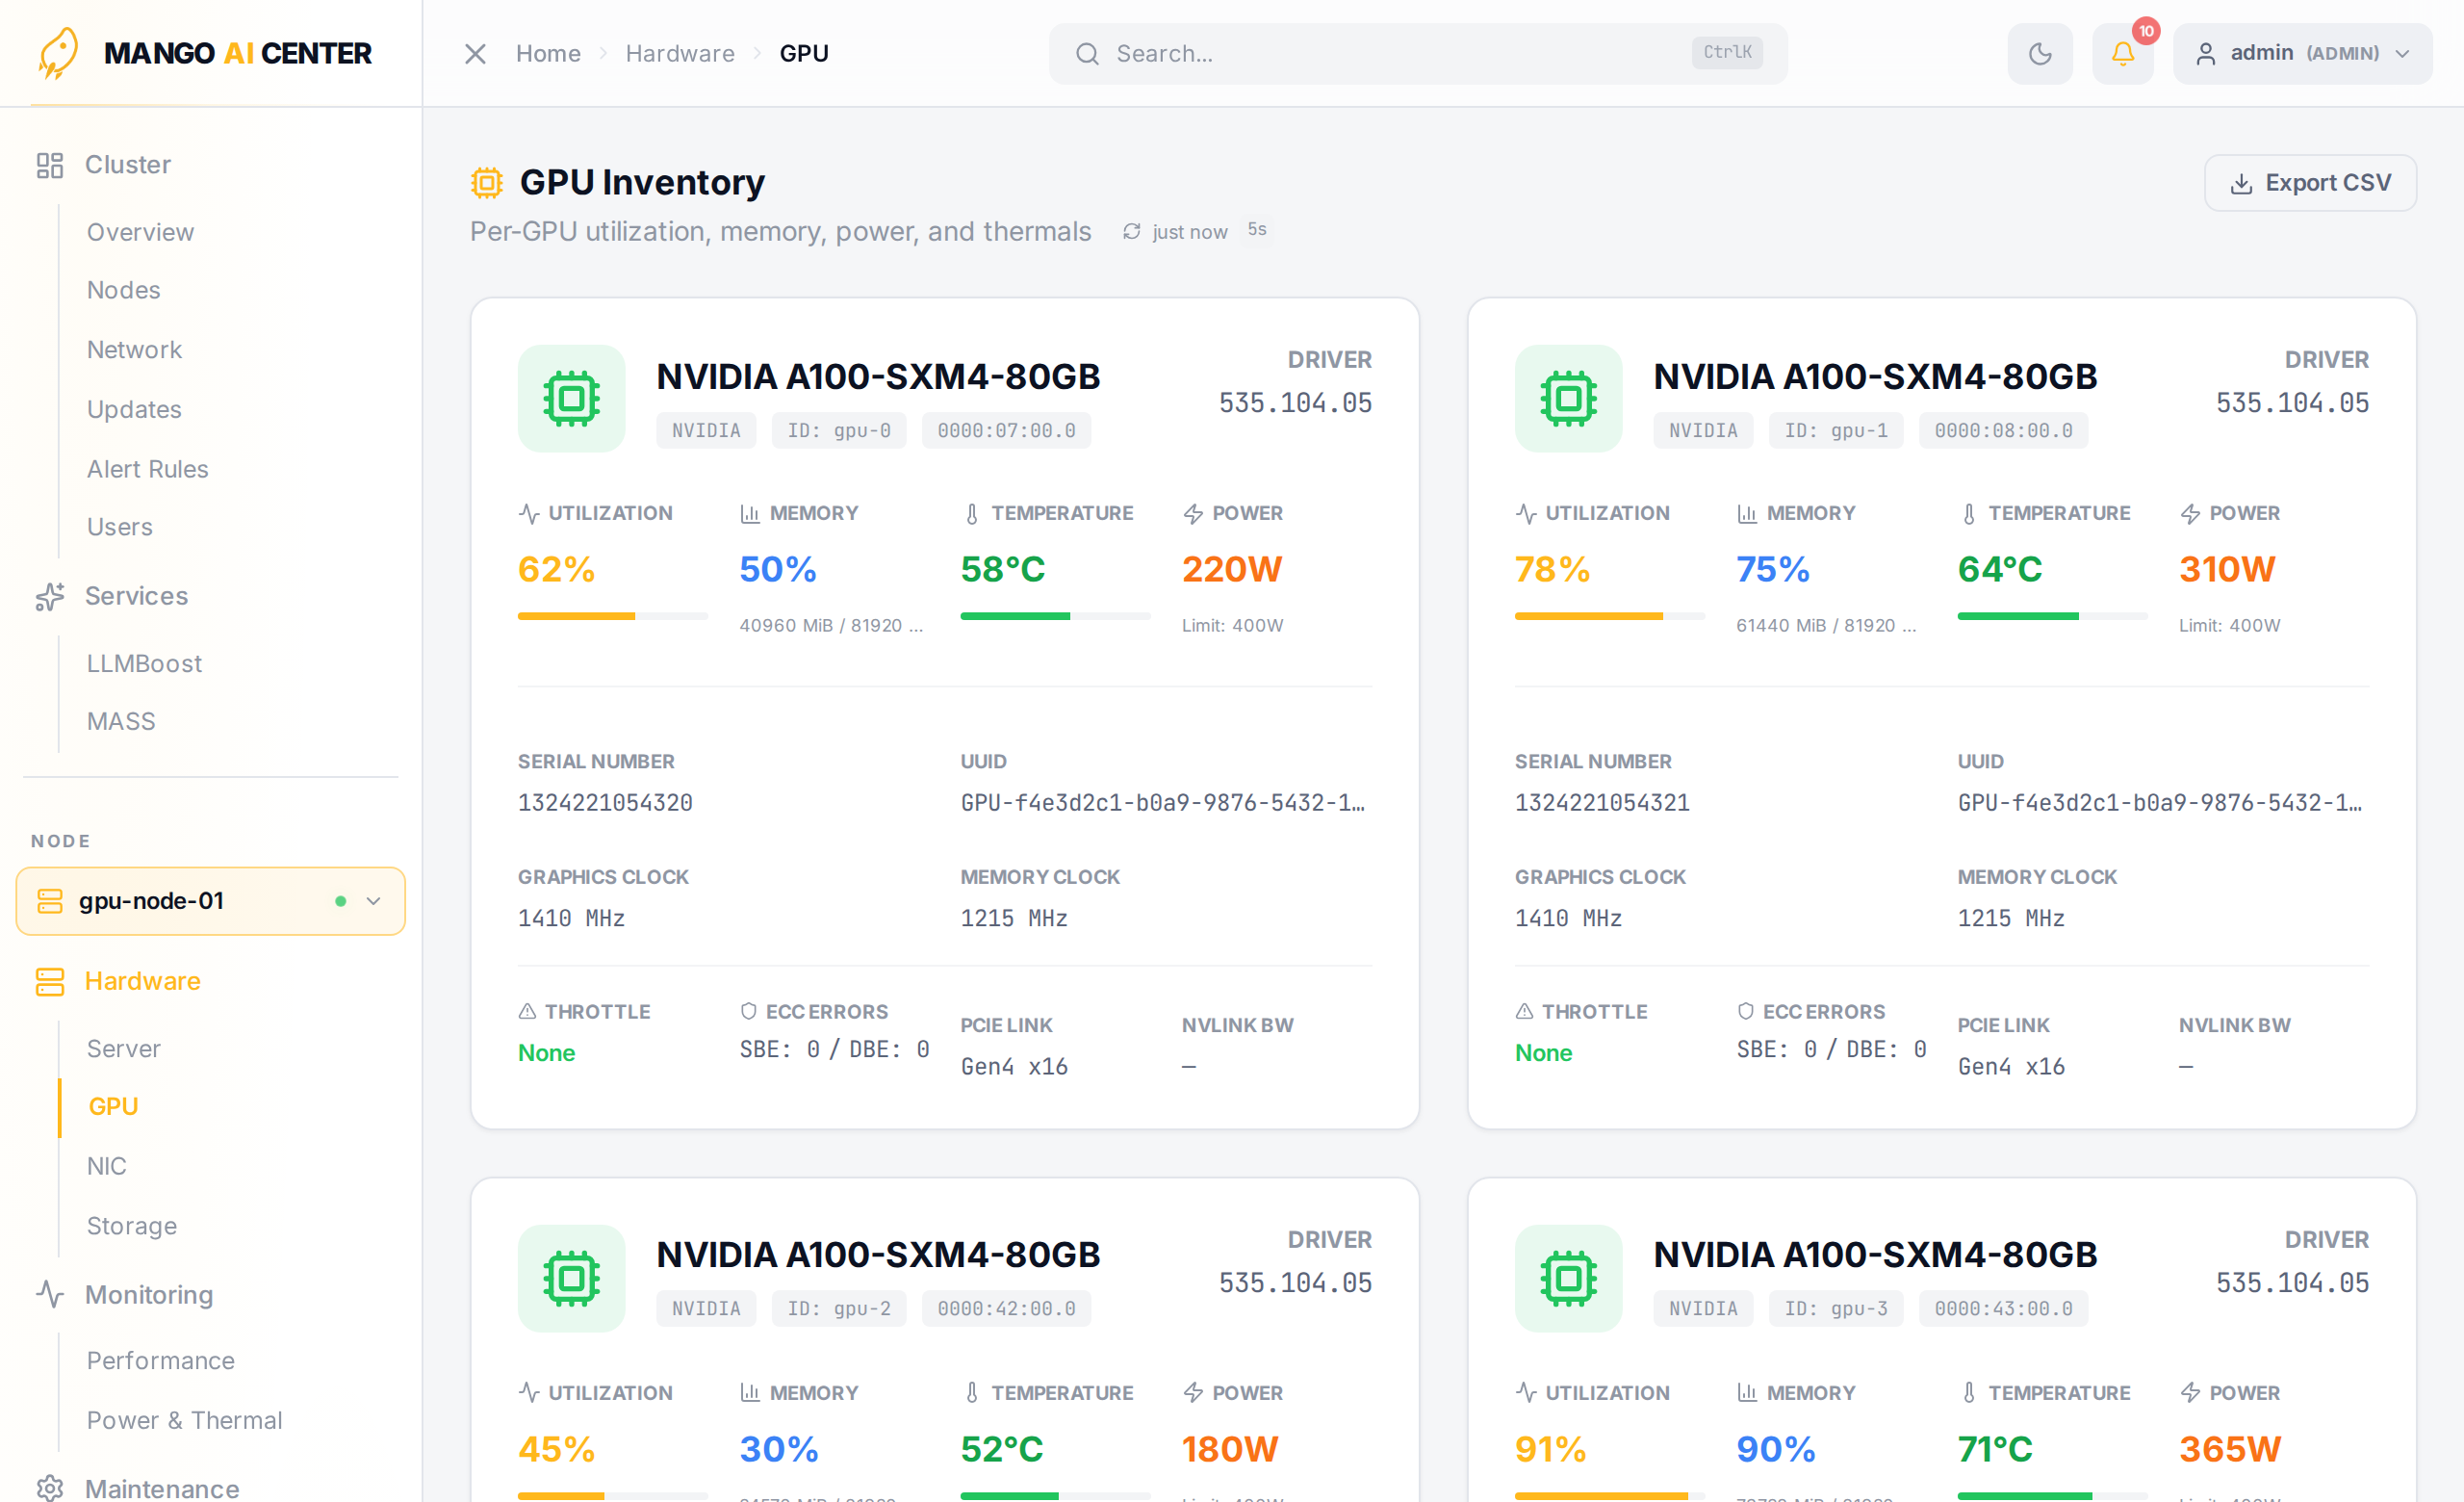
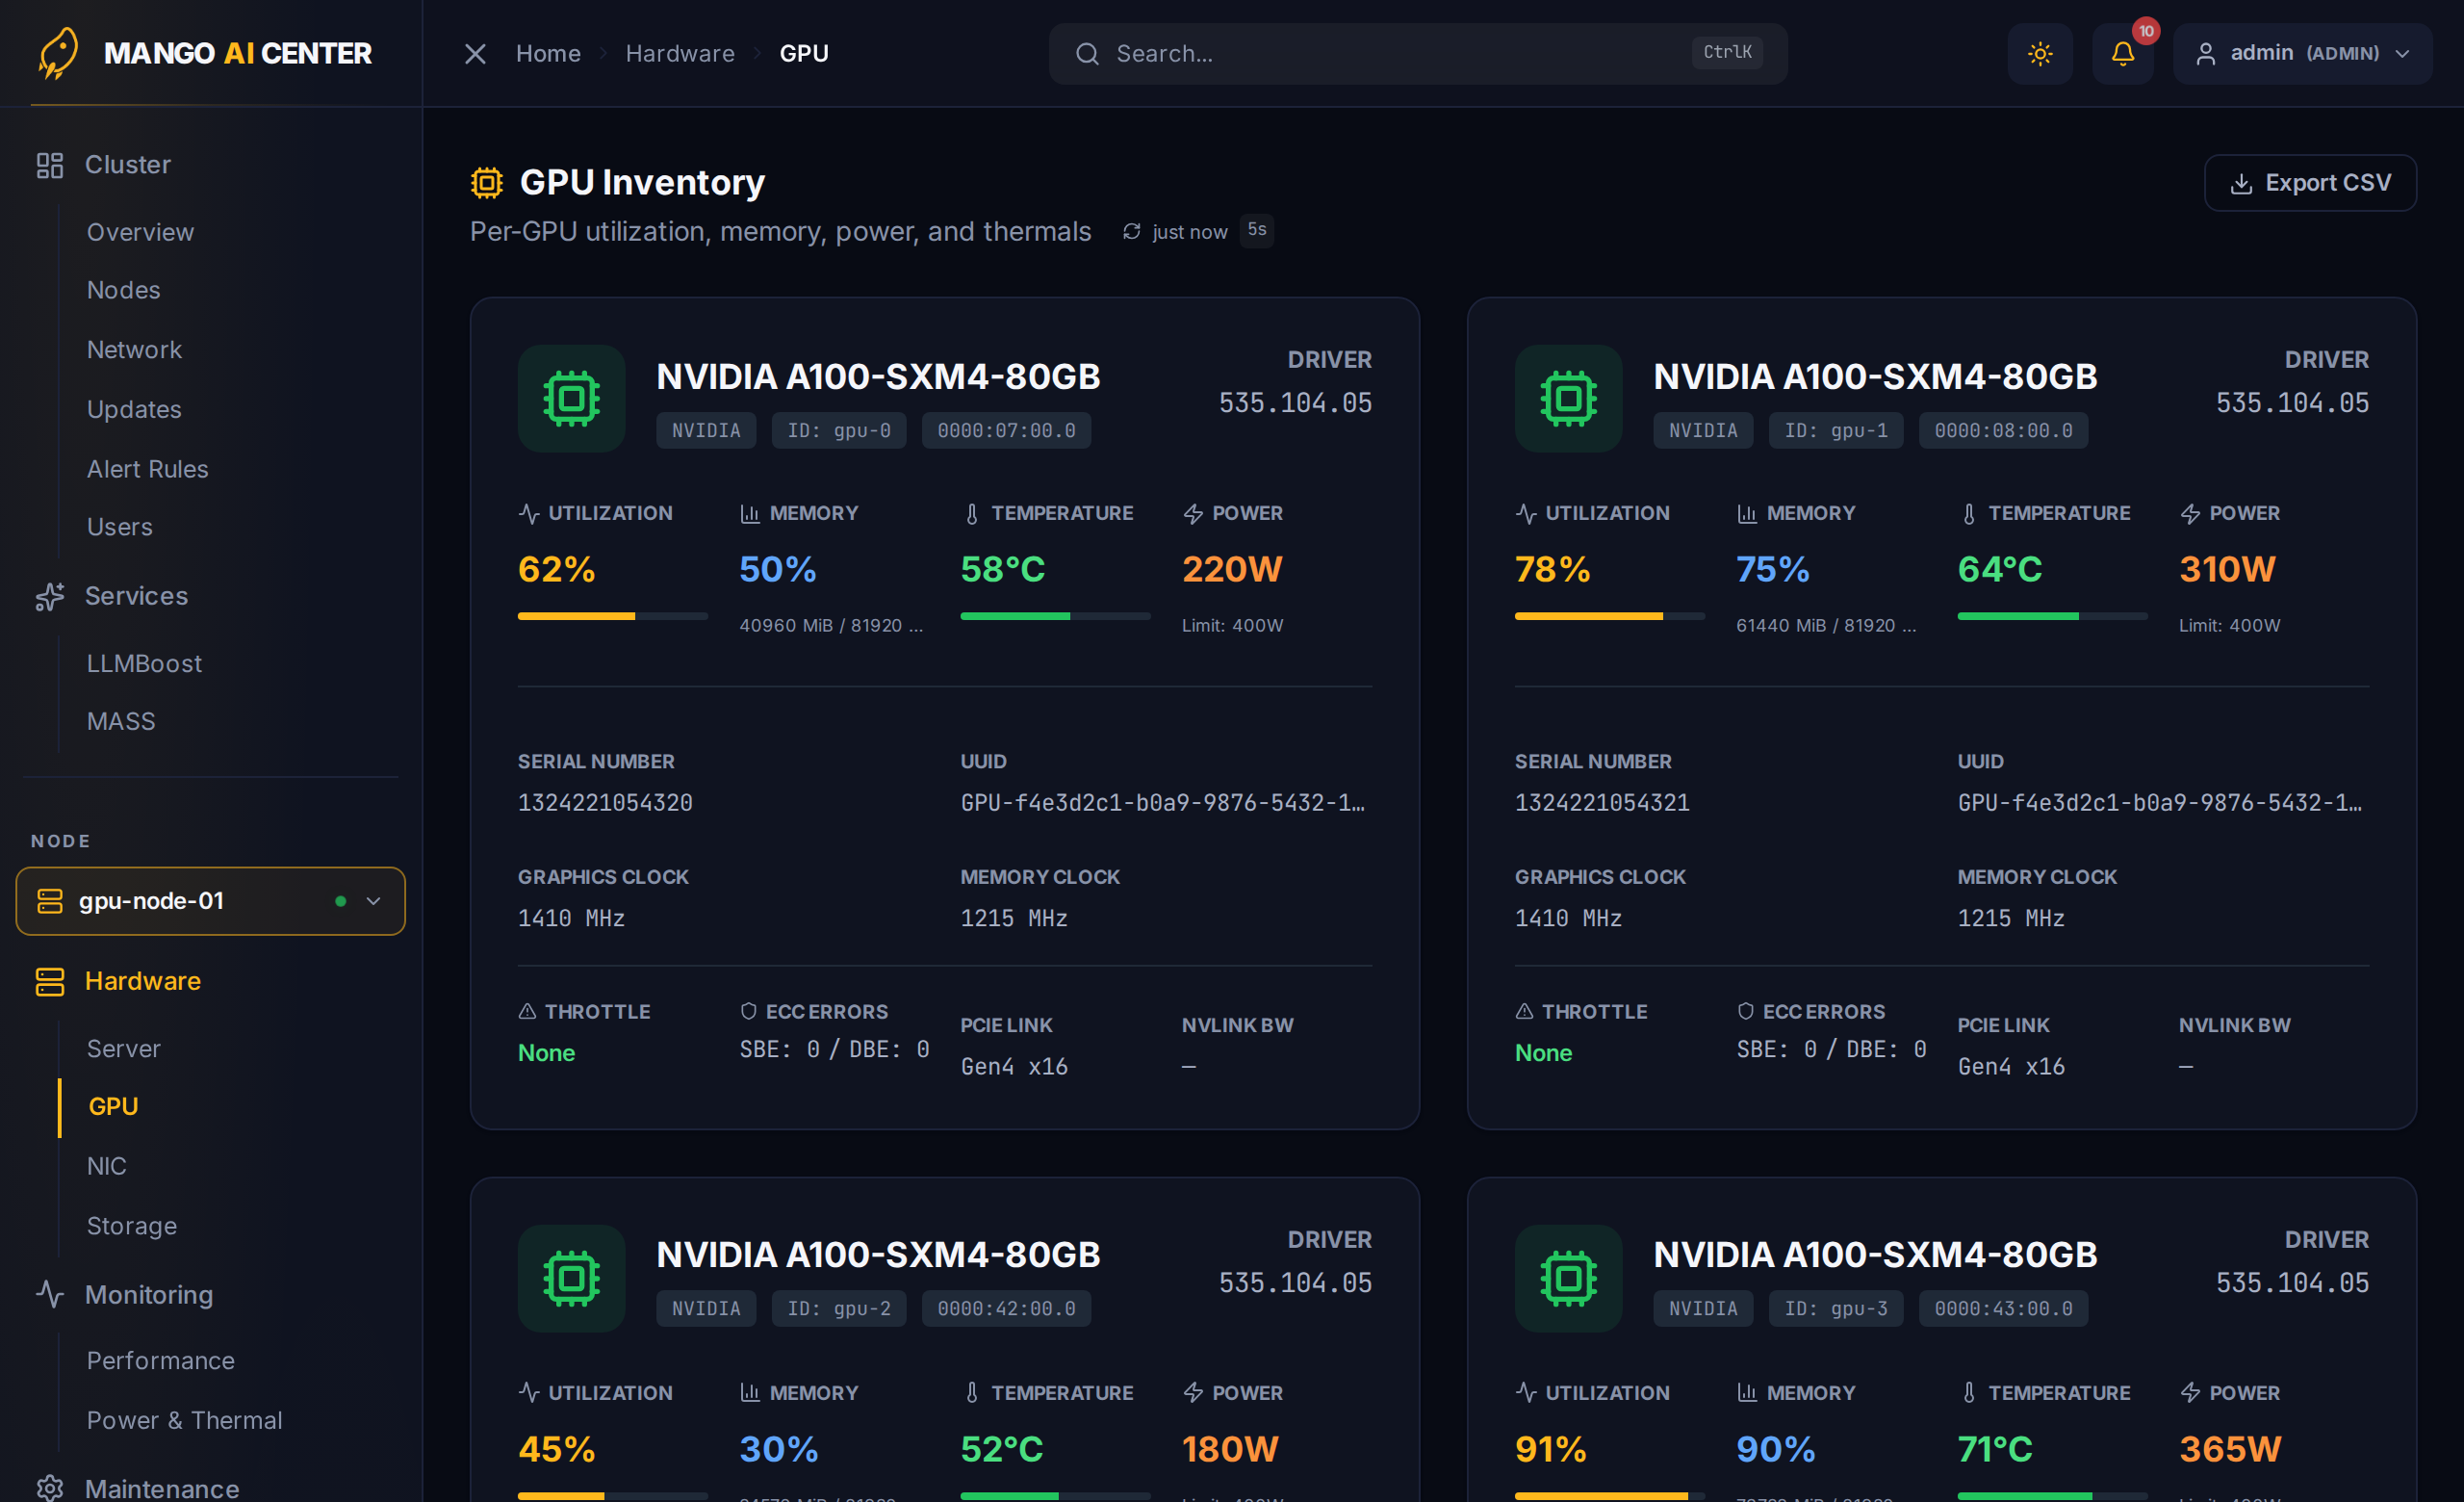
Per-Card Fields
| Field | What it means |
|---|---|
| Name | Marketing name (e.g. RTX PRO 6000 Blackwell Server Edition) |
| Driver | Vendor driver version reported by DCGM / ROCm |
| Utilization | SM / shader-engine activity (0–100 %) |
| Memory | Used / total VRAM, with a usage bar |
| Temperature | Hottest die sensor (°C); colored when over threshold |
| Power | Current draw (W), with the configured cap on the right |
| Serial | Vendor-reported GPU serial number |
| UUID | Stable hardware UUID (GPU-...) |
| Graphics Clock / Memory Clock | Live clock rates |
| Throttle | DCGM throttle reasons; None when the GPU is unconstrained |
| ECC Errors | Single-bit and double-bit error counters (NVIDIA) |
| PCIe Link | Negotiated speed × width |
| NVLink BW | Live NVLink bandwidth (when applicable) |
Export CSV
The button in the upper-right exports the current cards into a CSV — handy for spreadsheets, inventory audits, and procurement.
Multi-Vendor Notes
- NVIDIA GPUs source data from
dcgm-exporter; almost every field is filled. - AMD GPUs source data from
rocm-exporter; fields likeNVLink BWandThrottleare vendor-specific and shown as—.
See Also
- Performance — time-series view of utilization, memory, power
- Power & Thermal — heatmap and rolling thermal trace