Power & Thermal
Environmental view for the picked node — power draw, thermal sensors, and fan readings.
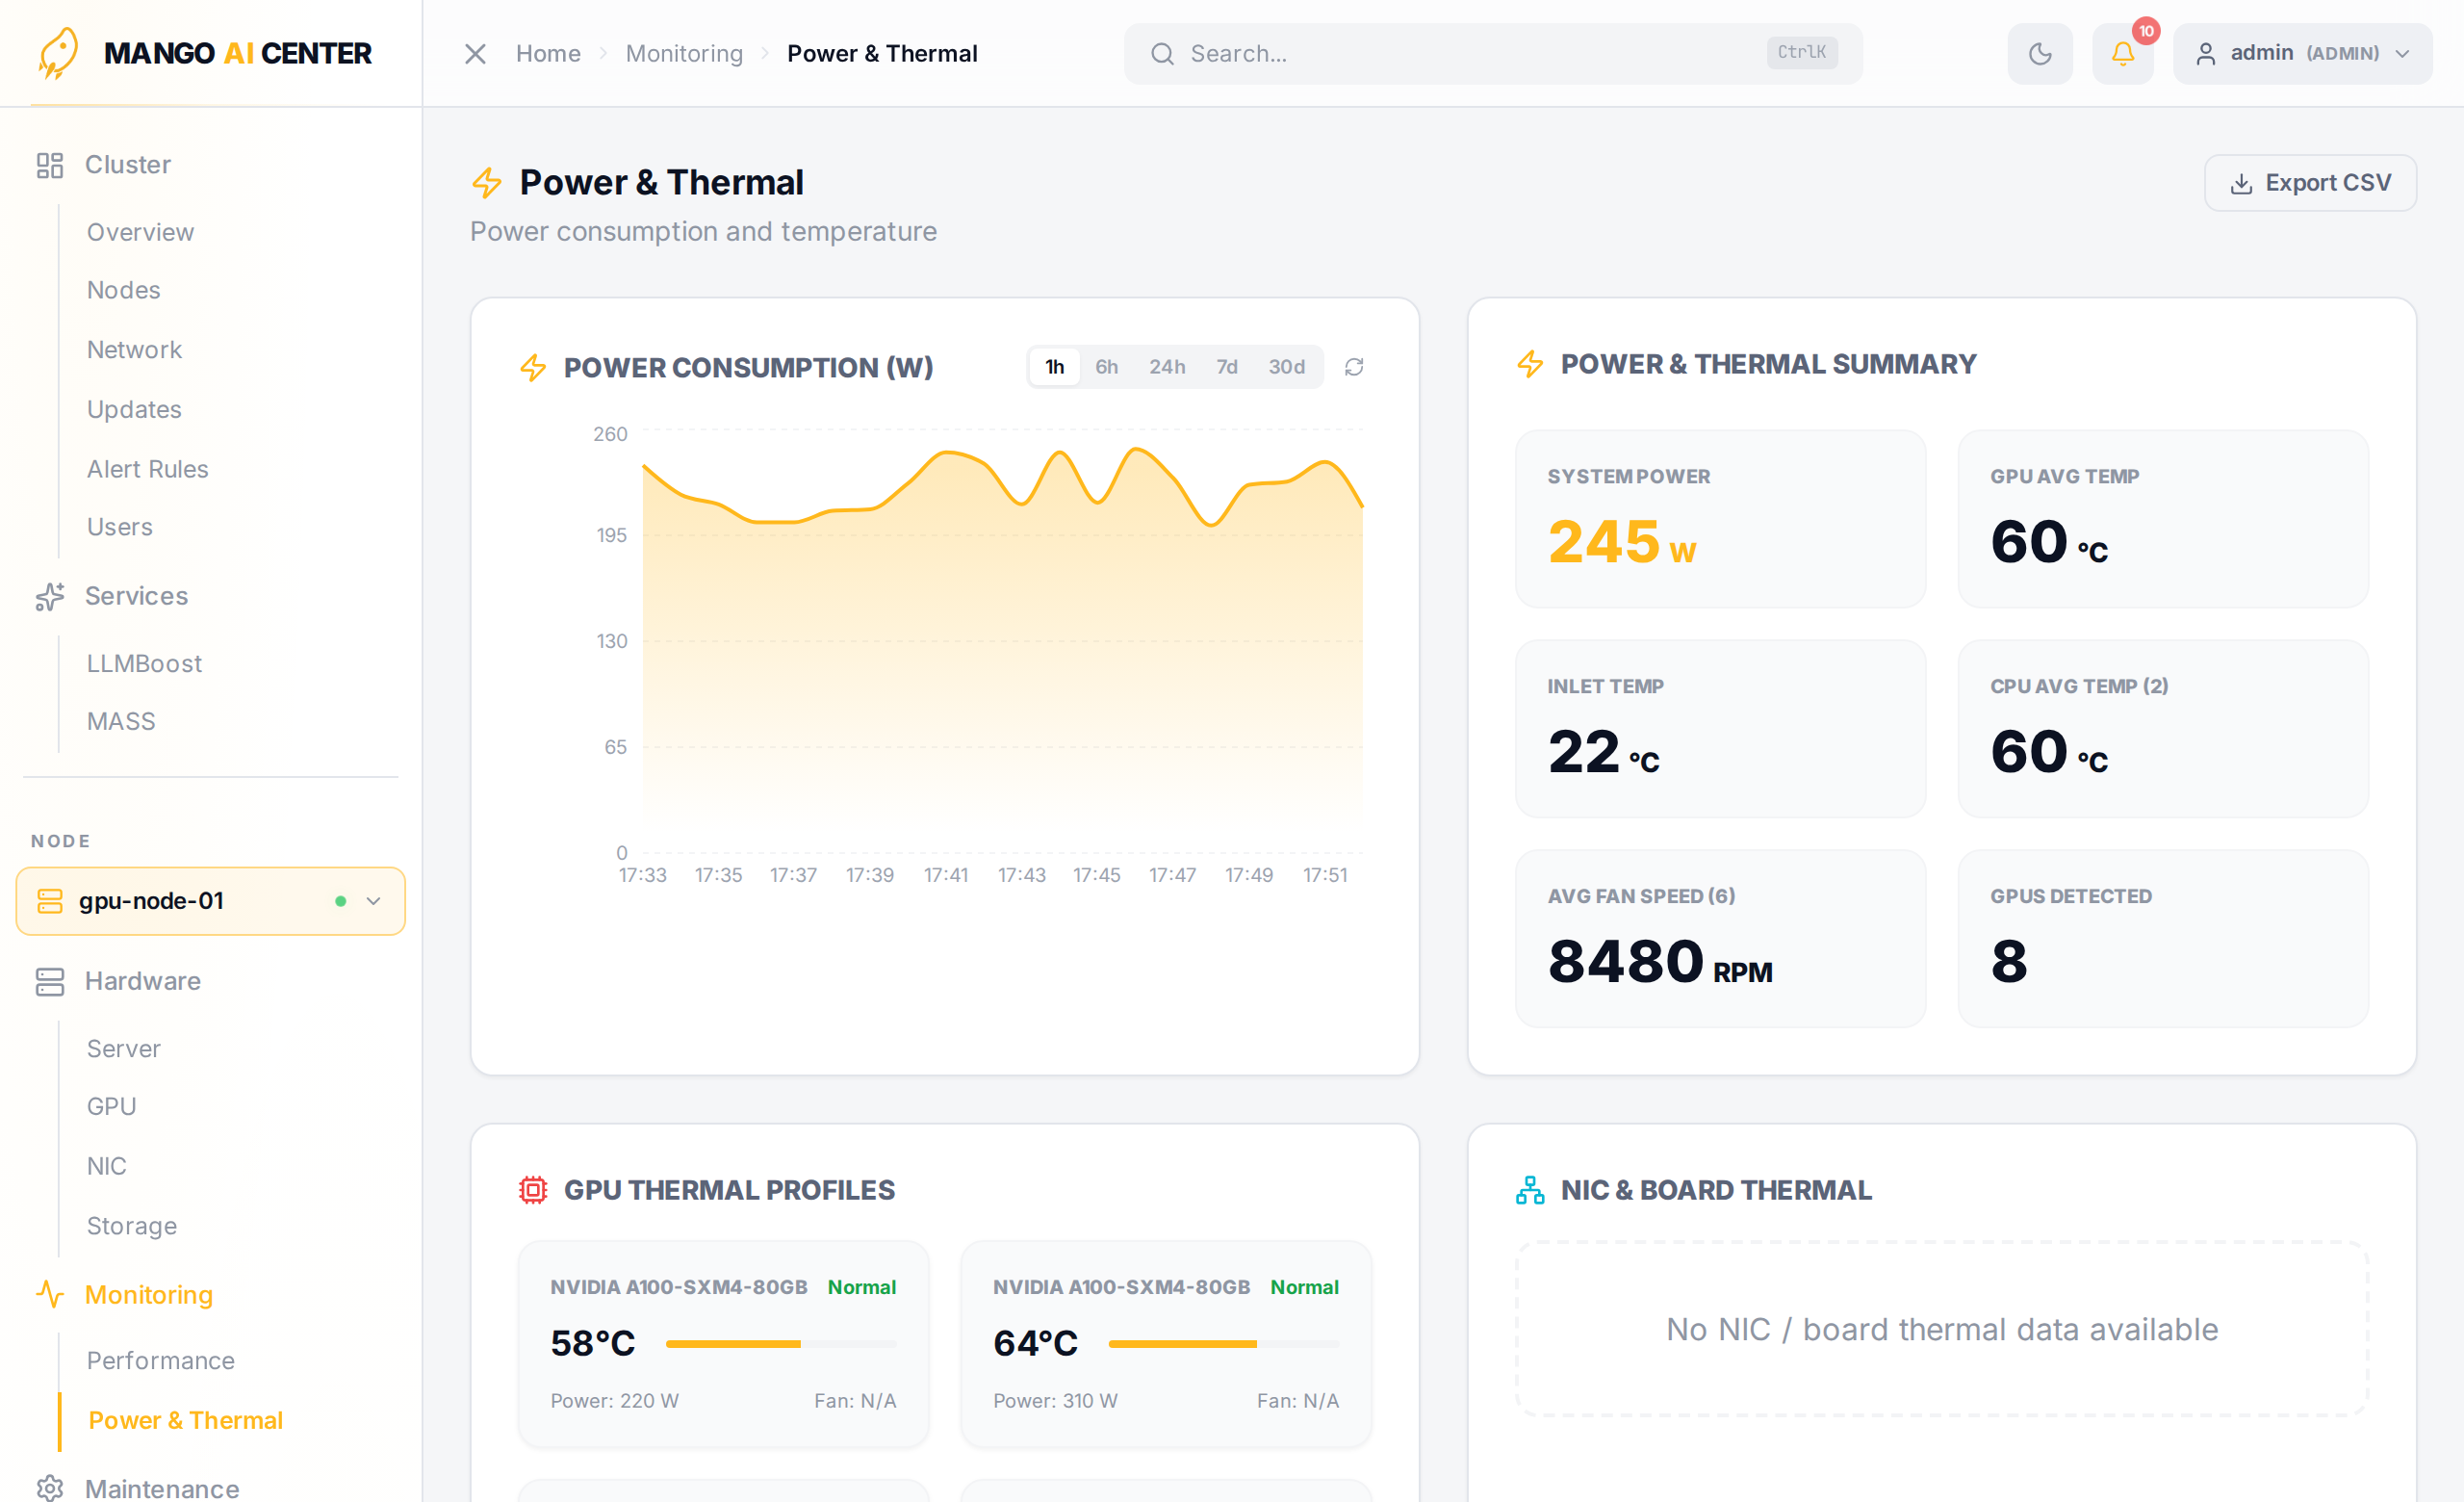
Power Consumption
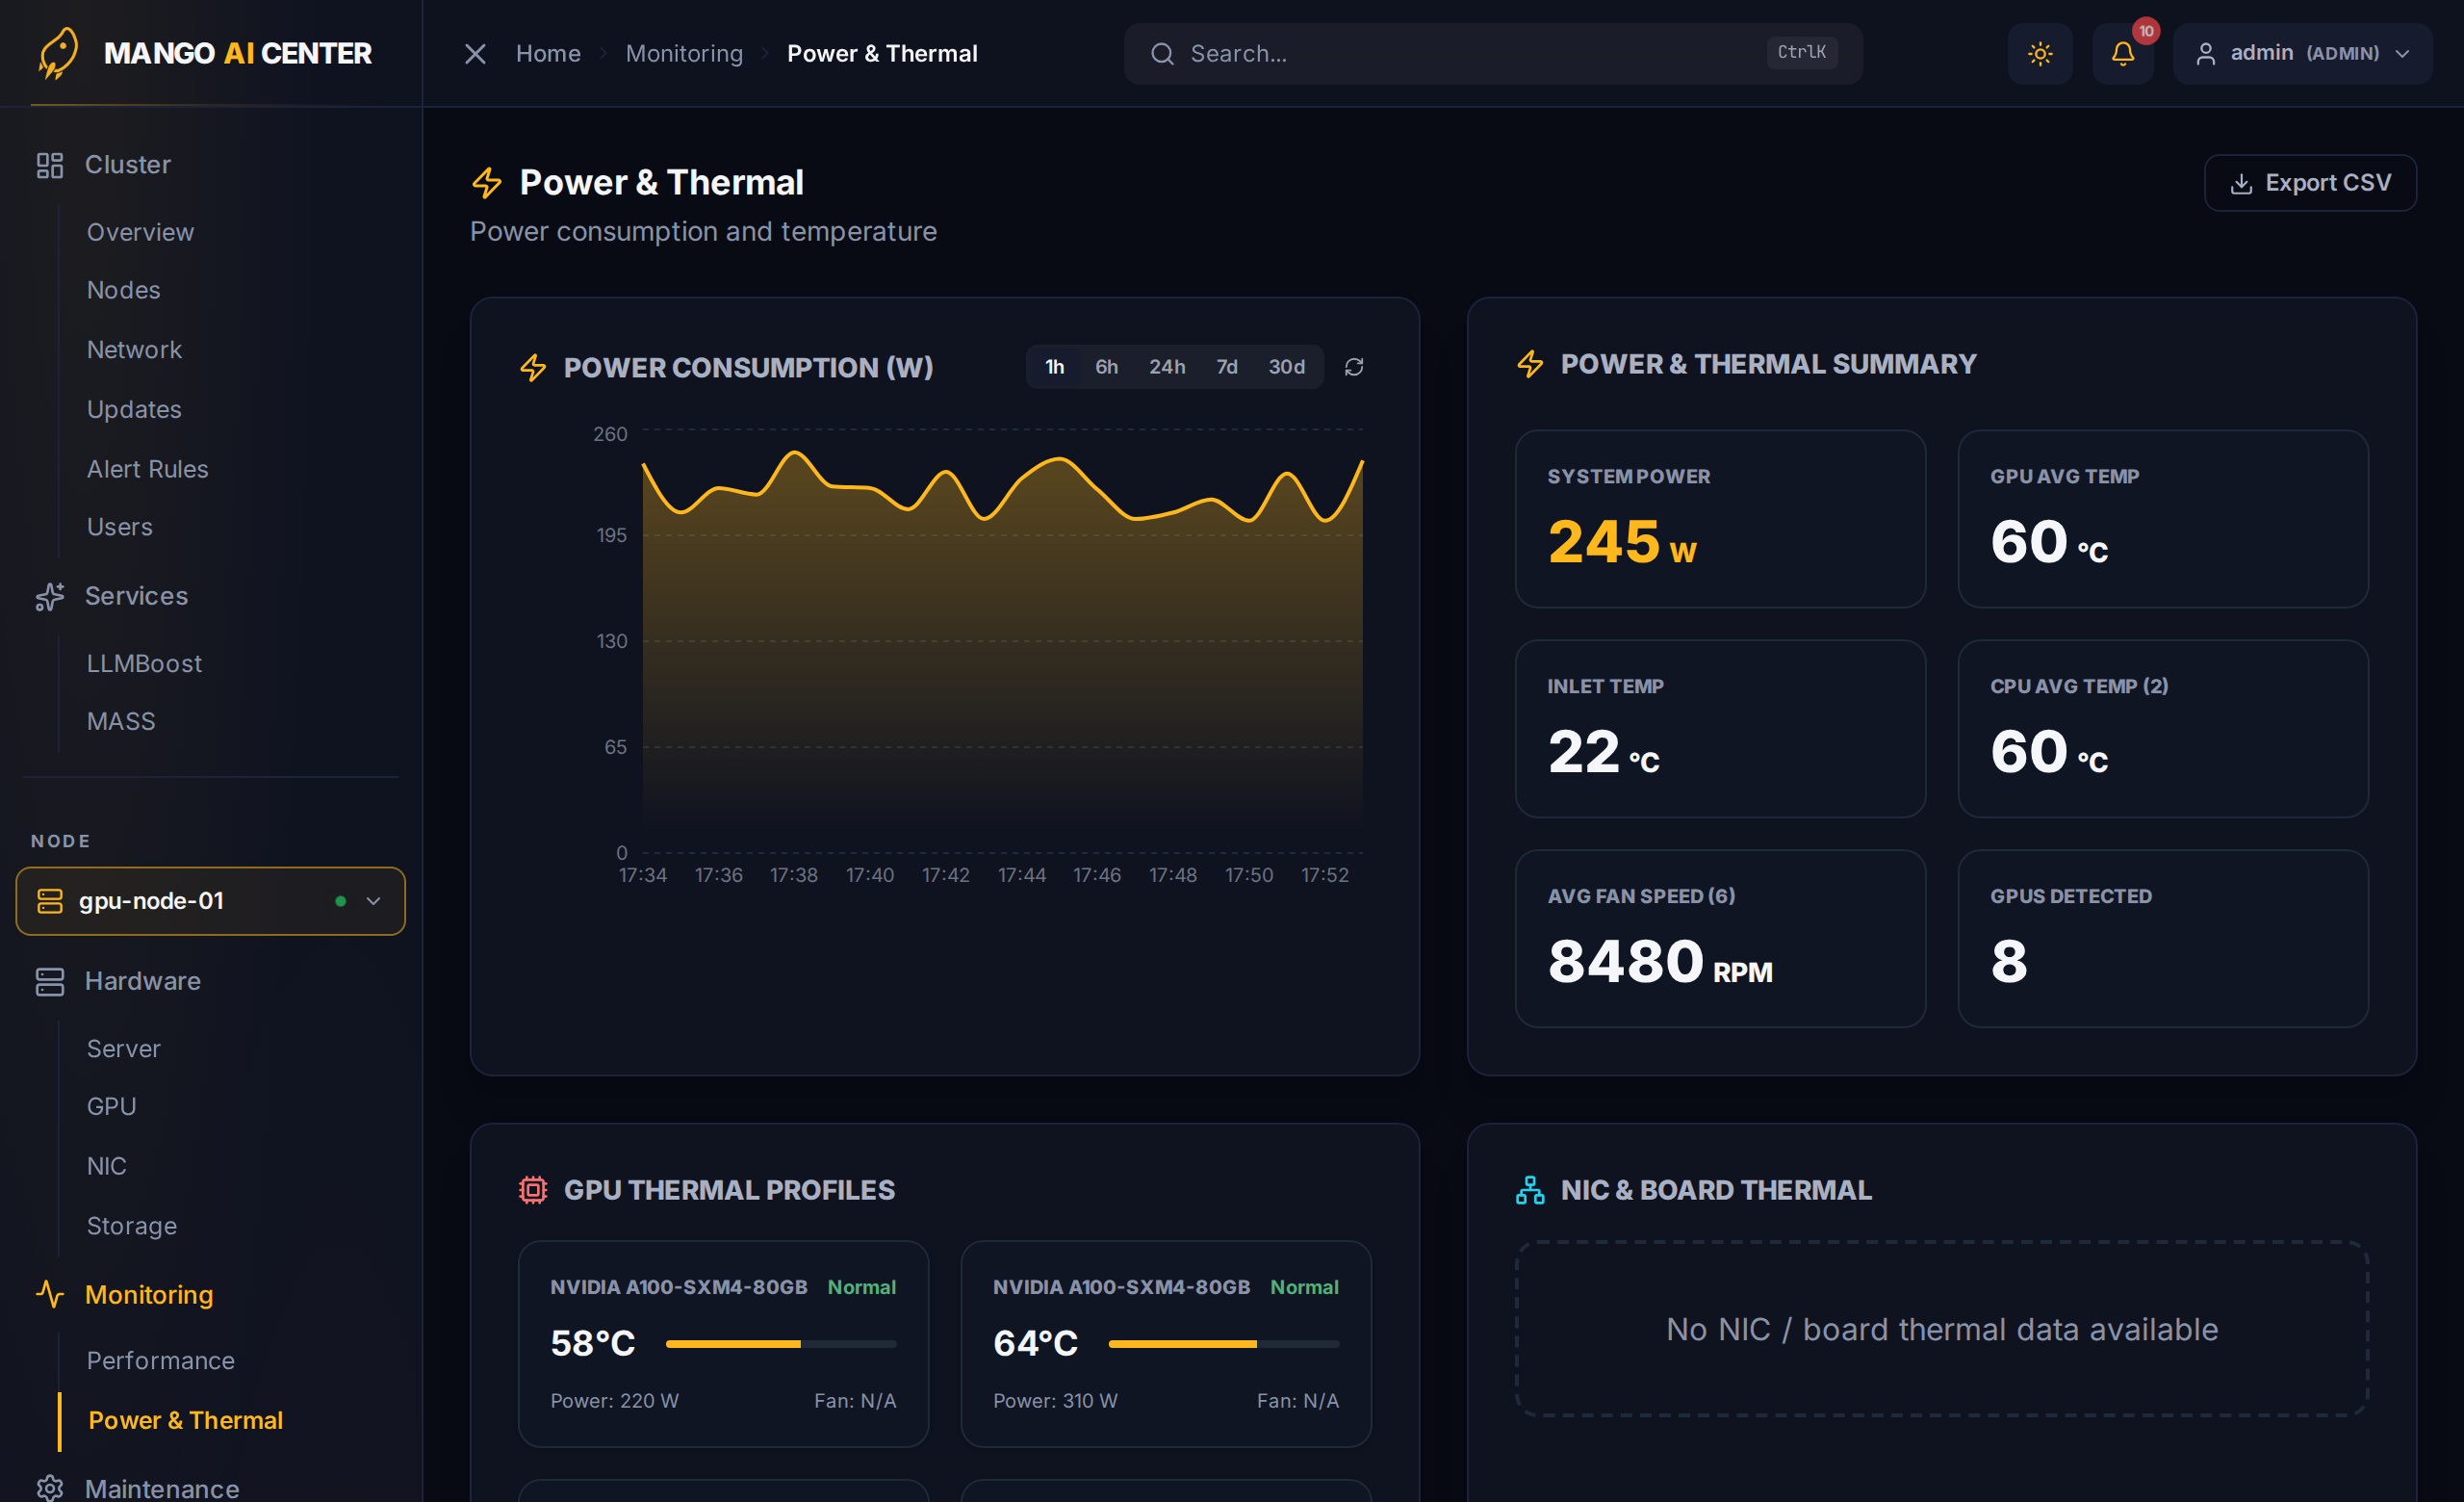
A time-series chart at the top plots the node's total power draw (W) over time. The time-range chips above the chart (1 h / 6 h / 24 h / 7 d / 30 d) change the window.
Power & Thermal Summary
A strip of summary tiles under the chart, sourced from BMC and exporter readings:
| Tile | Meaning |
|---|---|
| System Power | Current total power draw (W) |
| GPU Avg Temp | Average across all GPUs on this node, or — if no GPU |
| Inlet Temp | Chassis inlet (ambient) temperature |
| CPU Avg Temp | Mean CPU die temperature (with socket count) |
| Avg Fan Speed | Mean fan RPM across all chassis fans |
| GPUs Detected | Number of GPU devices reporting metrics |
GPU Thermal Profiles
One card per GPU with vendor-reported temperature sensors. The card is empty (No GPU thermal data available) on nodes without GPUs.
NIC & Board Thermal
Per-component temperatures pulled from on-board sensors. Entries are chassis-dependent
(e.g. NVMe / NIC / PCH / peripheral / retimer / VR), each with the current reading and a
status pill (Normal / threshold breach).
BMC Thermal Sensors
The flat list of every named sensor surfaced by the BMC (CPU dies, CPU VRM zones, DIMM banks, inlet, system). Useful for chasing a single hot spot that the summary tile averages out.
Fan Readings
Per-fan RPM (FAN2, FAN4, …) for every chassis fan that the BMC exposes.
When Operators Open This Page
- Hot rack chasing — scan the summary tiles for a node whose GPU Avg Temp or Inlet Temp sticks out from its peers.
- Pre-summer audit — flip to a 7-day range on the chart to see whether cooling is keeping pace as ambient creeps up.
- Power budgeting — sum the per-node System Power against your rack PDU limit before bringing more workload online.
Use Export CSV in the upper right to dump every tile and sensor value into a spreadsheet.