Performance
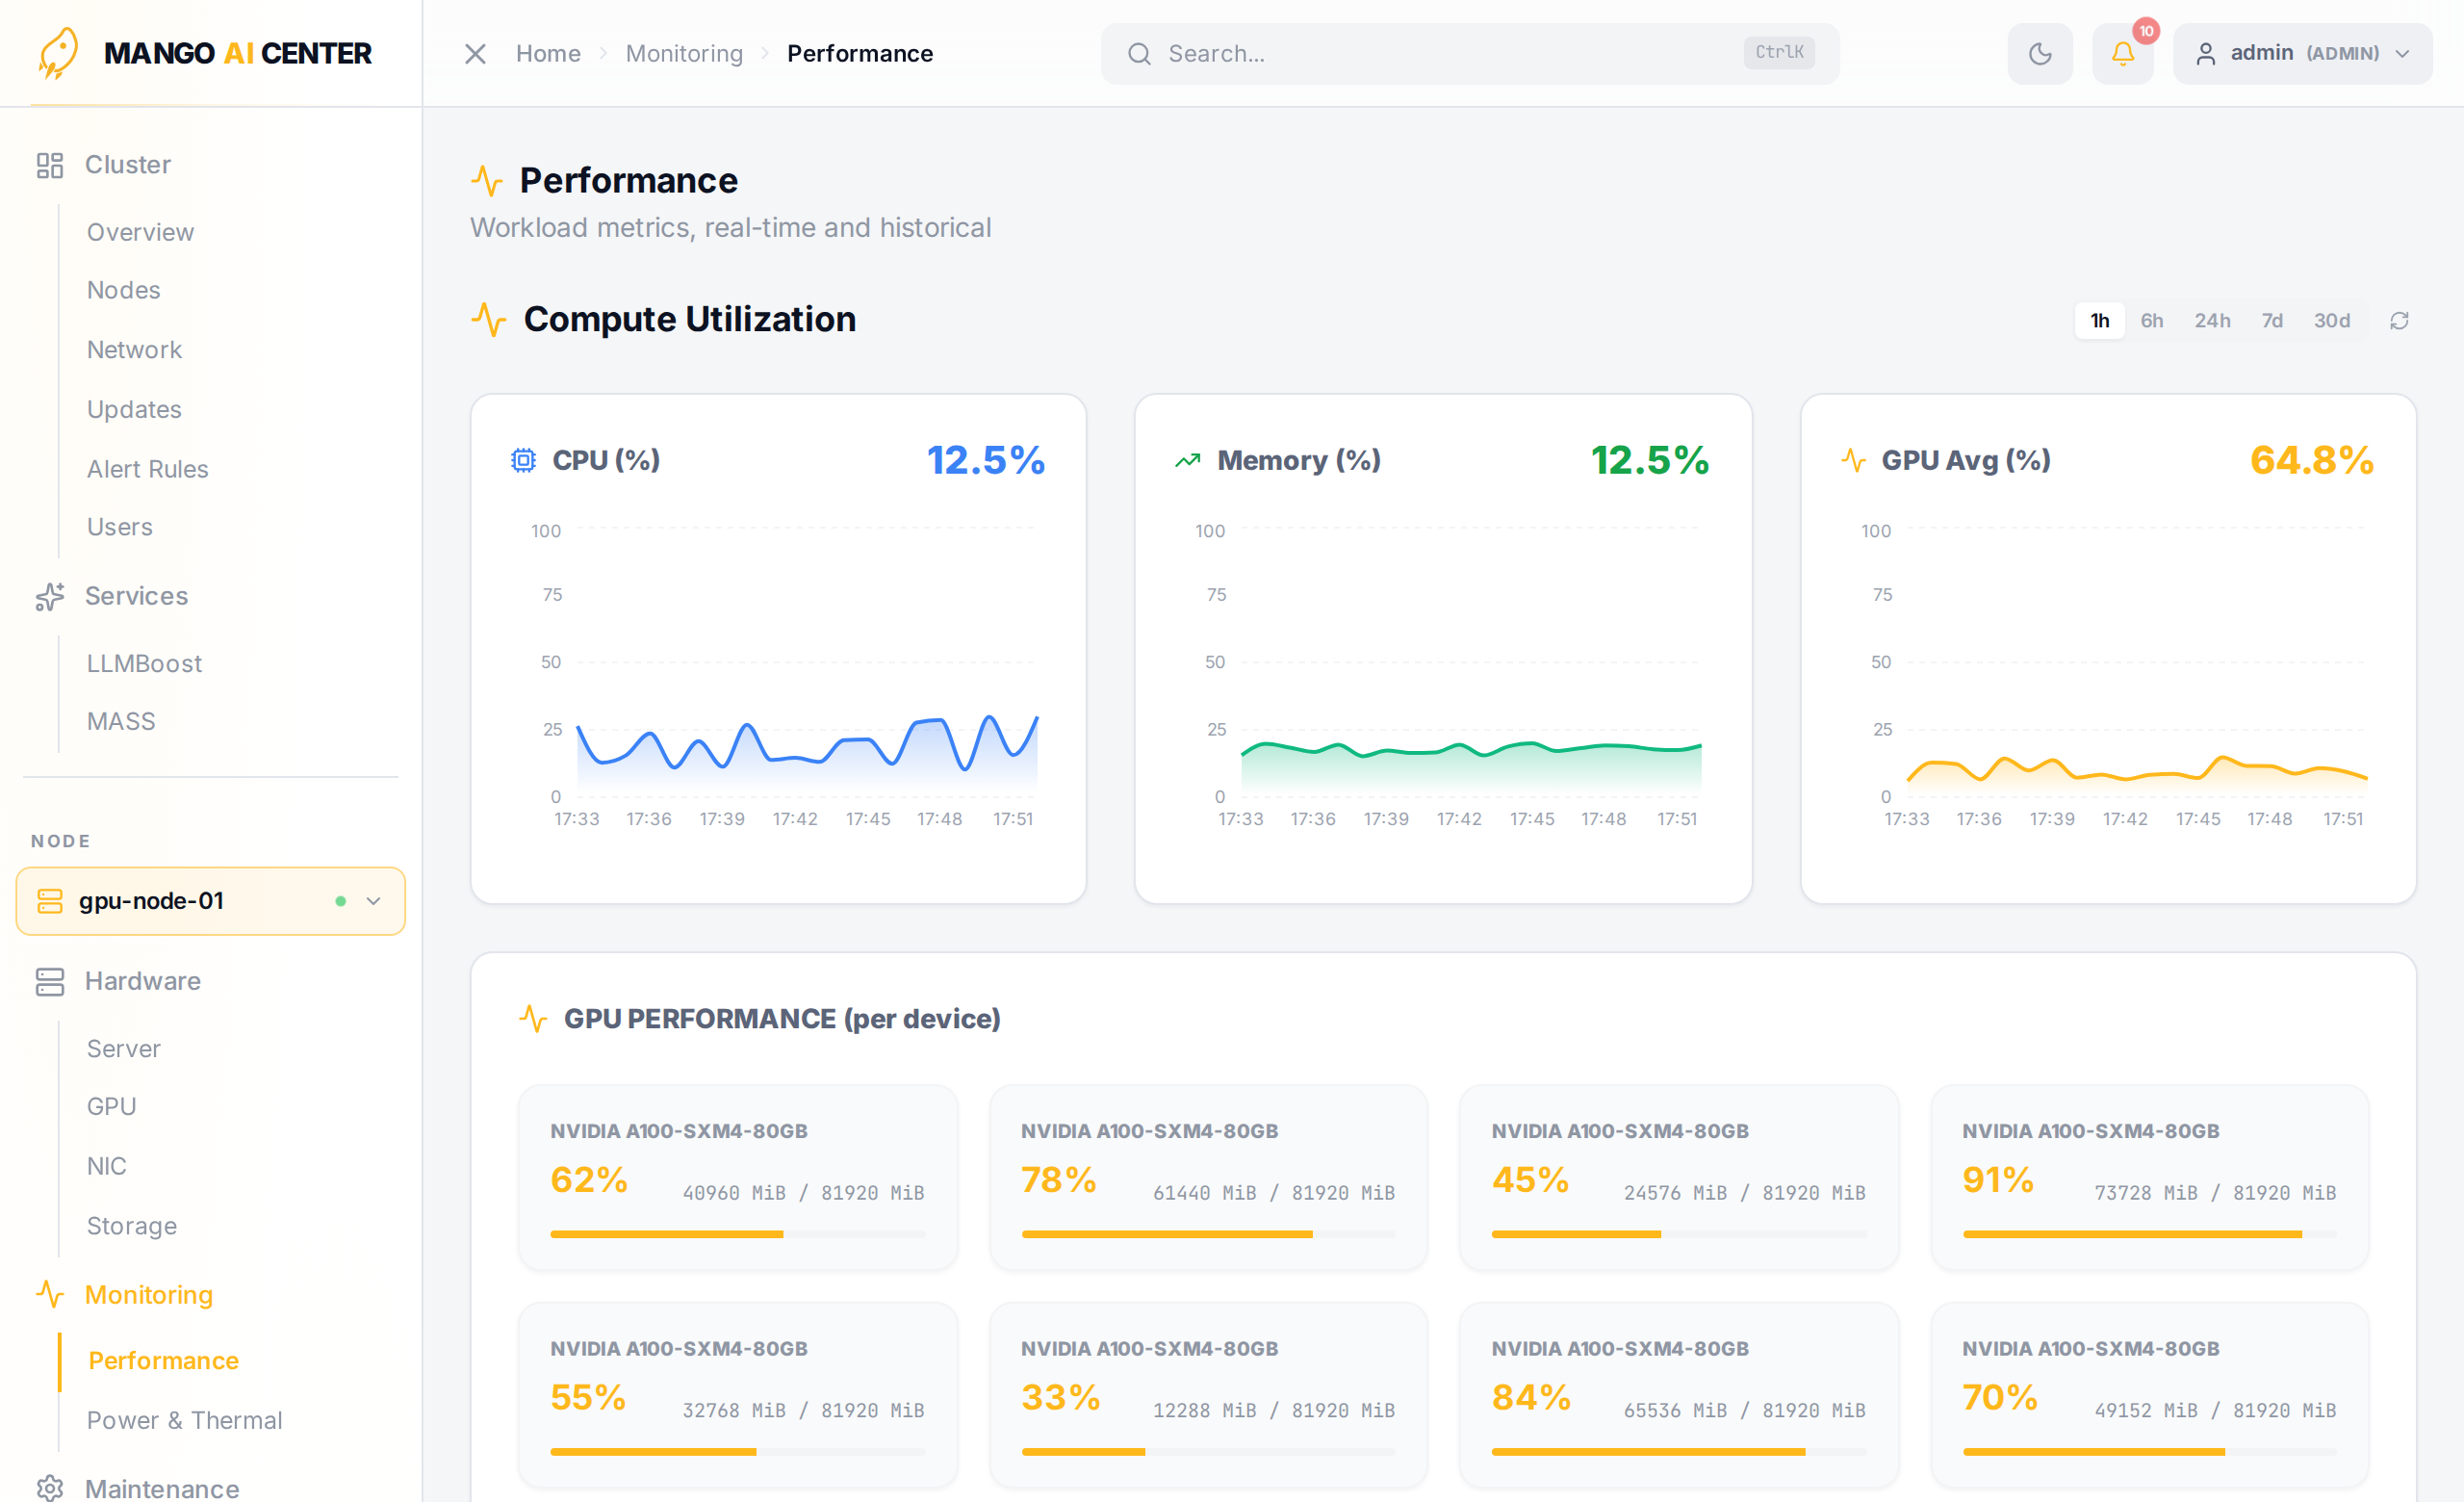
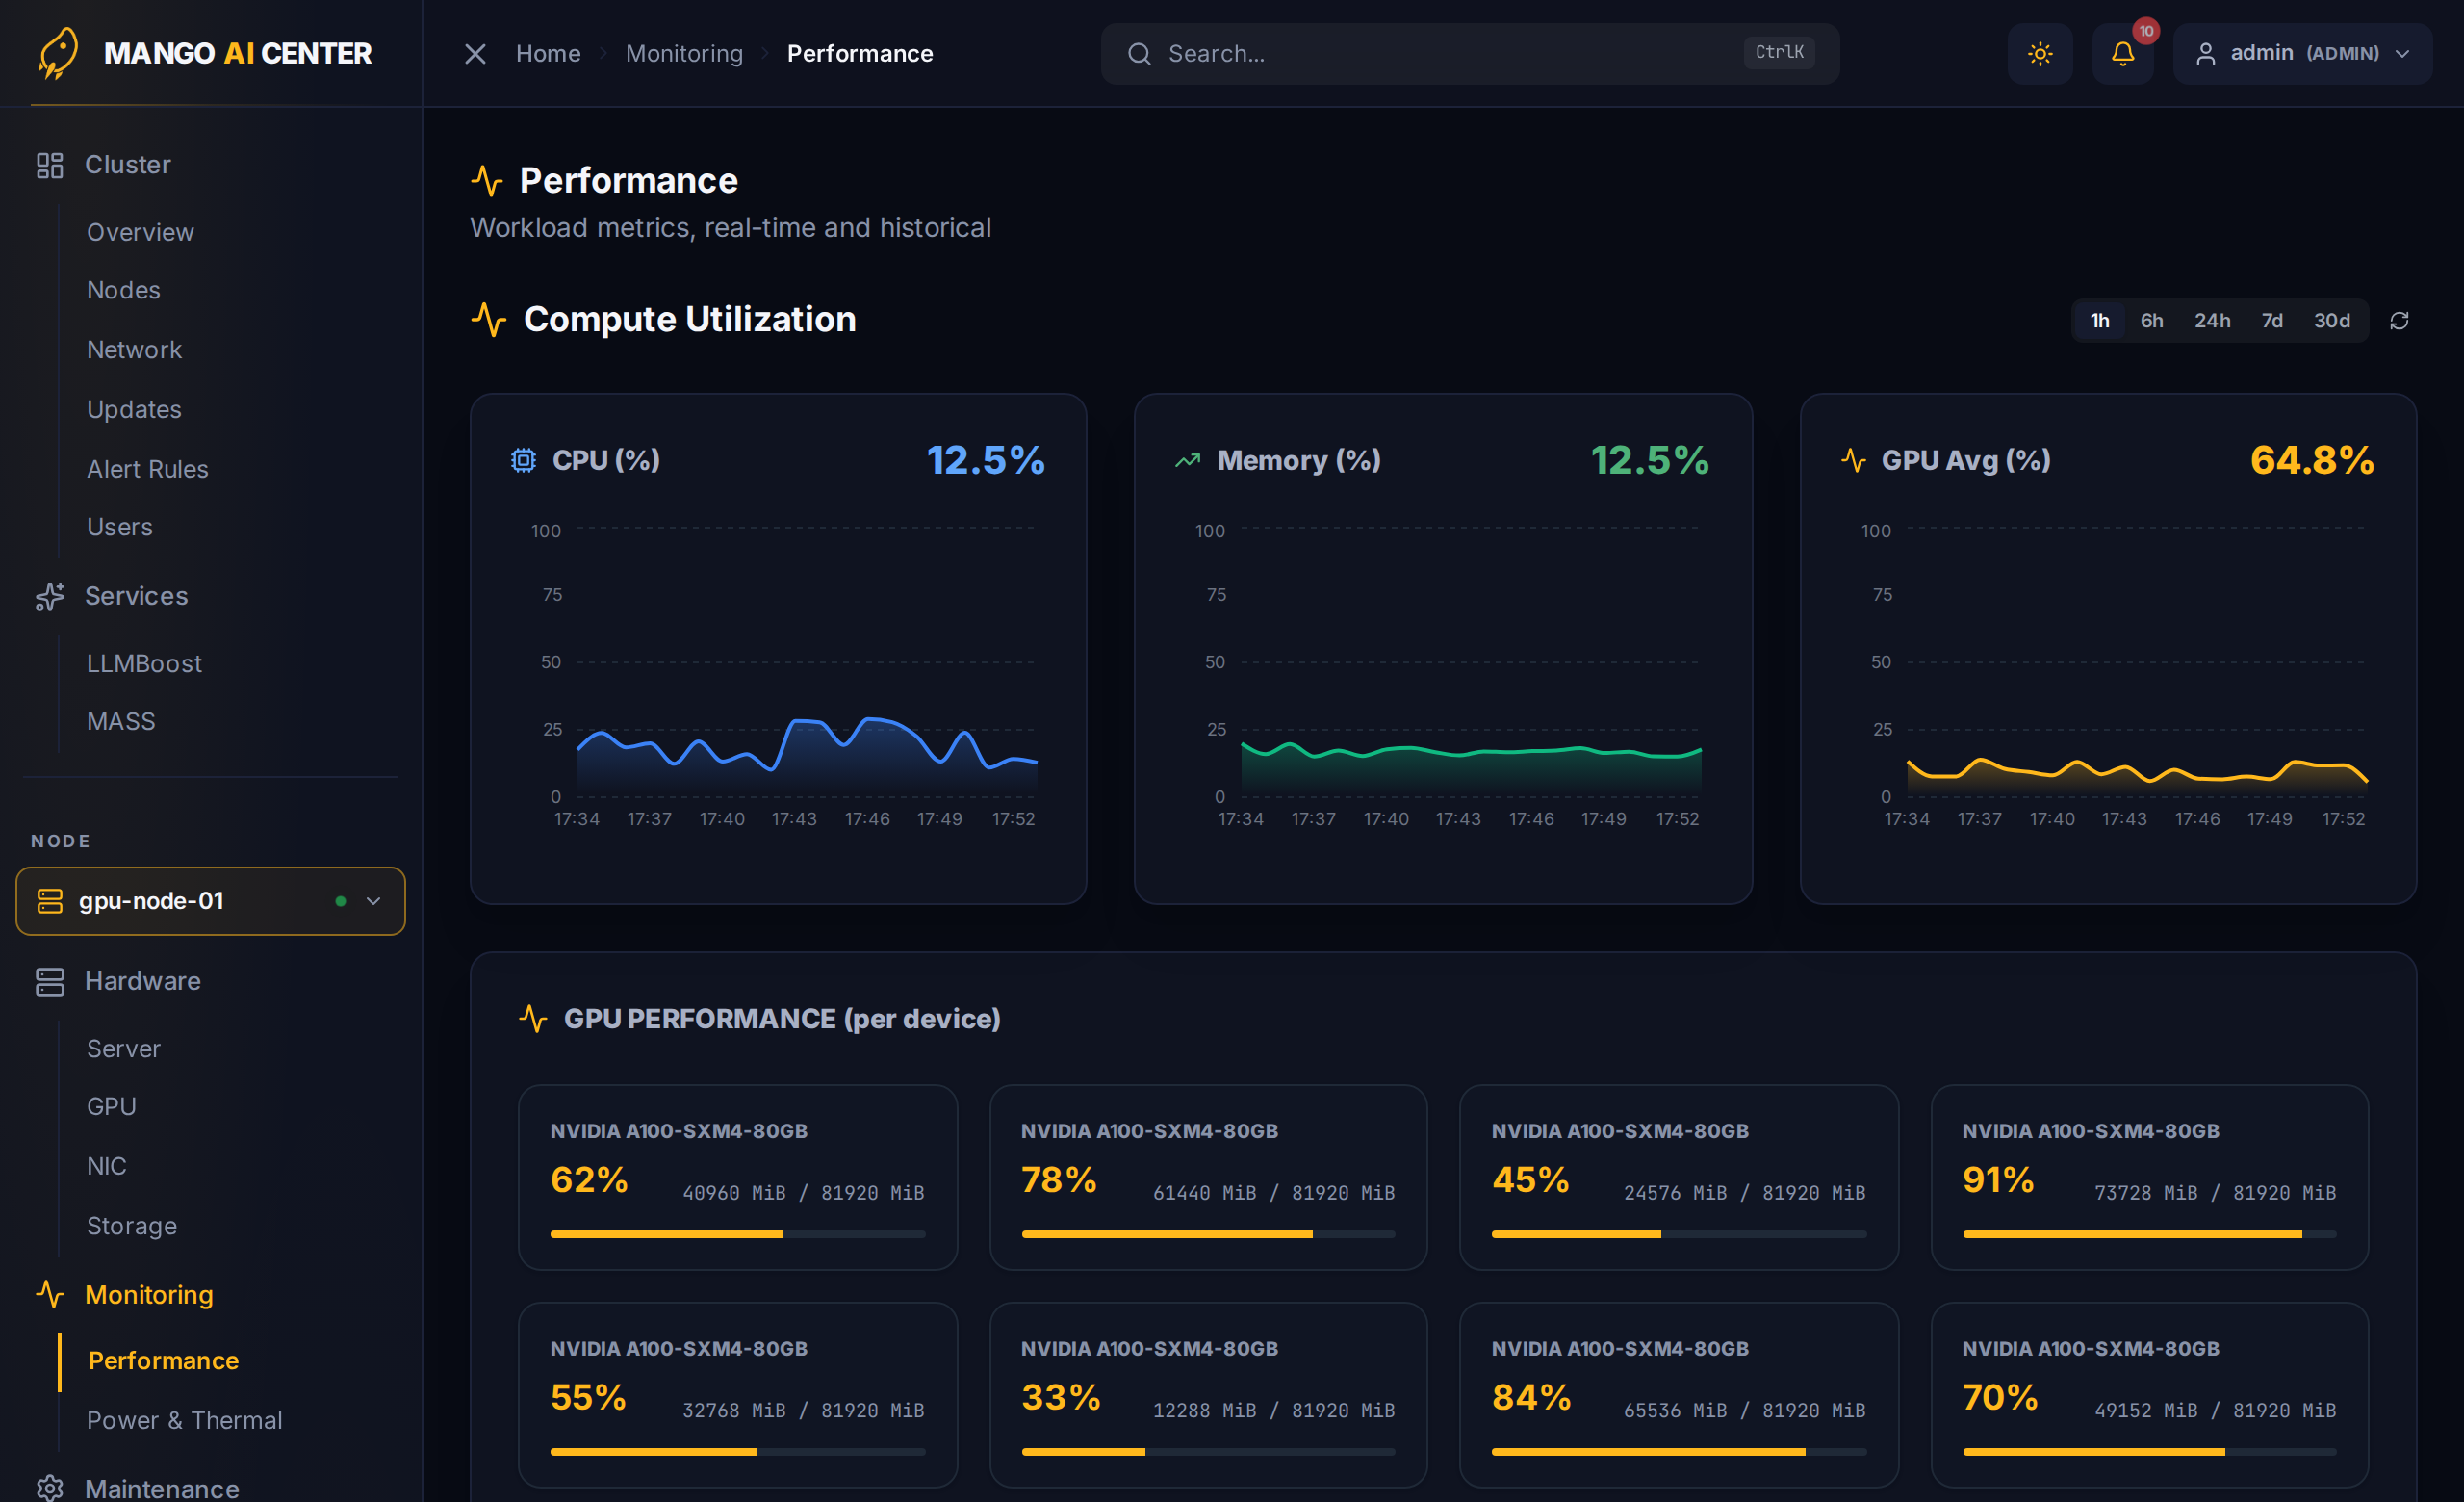
Time-series view of compute, storage I/O, and network activity on the picked node. The page is one scrollable layout with three sections in a fixed order — Compute first, then Storage I/O, then Network Bandwidth. Charts roll forward in real time; pick a longer range from the time picker (1 h / 6 h / 24 h / 7 d / 30 d) to zoom out.
Compute Utilization
Three charts side-by-side at the top:
- CPU (%) — host CPU utilization
- Memory (%) — host RAM utilization
- GPU Avg (%) — average across all GPUs on this node
Each chart shows the live numeric value at the top-right and the trend below.
Below the strip is a GPU Performance (per device) card with one tile per GPU, showing its utilization spark and current value. This is the fast-twitch view used during a workload — pop it open while a training job is running to see whether the GPUs are actually being saturated.
Storage I/O
Per-device read / write throughput and IOPS, plus latency and in-flight queue depth, for every block device on the node. The cards mirror the Storage Inventory order so it is easy to map a slow device back to its hardware.
Network Bandwidth
One card per NIC port, with port metadata (link state, vendor, BDF, RoCE device, IP, MAC, MTU, LLDP-peer switch and port) above an RX/TX bandwidth chart. Each card has its own zoom-window chips (30 s / 1 m / 5 m / 10 m) so you can see line-rate transfer events that minute-resolution dashboards would miss.
Time Range
The chips above the Compute charts (1 h / 6 h / 24 h / 7 d / 30 d) change the window for the Compute section. Hover any chart for a precise value at a timestamp.
See Also
- Power & Thermal — environmental view of the same node
- Cluster Overview — fleet-wide aggregate